Most Shopify stores are fighting for tiny gains because the baseline is brutally low. The average e-commerce conversion rate globally hovers around 2-3% according to Salesforce commerce metrics. That means the overwhelming majority of visitors leave without buying.
That’s why e commerce key performance indicators matter so much. They’re not reporting cosmetics. They tell you where money leaks out of the funnel, which channels deserve more budget, and which customer questions are undermining orders.
A good KPI system also changes how you run the store. You stop reacting to random sales swings and start diagnosing causes. You notice whether traffic quality dropped, checkout friction increased, or support delays pushed buyers away. And once you bring AI-assisted support into the mix, you get a new layer of store data that standard dashboards often miss, especially around real-time questions, assisted purchases, and recovery moments.
Table of Contents
- Why Your Store's Data Is Its Most Valuable Asset
- Understanding the Three Types of E-Commerce KPIs
- Core Sales KPIs for Measuring Profitability
- Marketing and Acquisition KPIs for Smart Spending
- Customer Experience KPIs for Building a Loyal Brand
- Building Your Shopify KPI Dashboard
- Turn Your Data Into Dollars
Why Your Store's Data Is Its Most Valuable Asset
Inventory matters. Creative matters. Paid media matters. But the asset that compounds fastest is your store’s data, because it tells you what buyers do instead of what you hope they do.
A lot of merchants still treat KPIs like a monthly reporting chore. That’s a mistake. The useful numbers are the ones that help you make an operating decision today, not the ones that sit in a dashboard until the next meeting.
When store owners say, “traffic is up but sales feel flat,” they usually have a KPI problem before they have a traffic problem. They’re looking at sessions without understanding conversion efficiency, order quality, or checkout friction. They know something changed, but not where.
Practical rule: If a metric can’t help you choose an action, it’s noise.
The best e commerce key performance indicators work like a control panel. Each one answers a different question:
- Sales metrics tell you whether visits are turning into orders and revenue.
- Marketing metrics tell you whether you’re buying traffic profitably.
- Customer experience metrics tell you whether shoppers trust the store enough to complete a purchase and come back.
That last category gets underestimated. On many Shopify stores, buyers don’t leave because they hate the product. They leave because they can’t get a fast answer on shipping, sizing, returns, ingredients, compatibility, or delivery timing. If you don’t track those moments, you’ll blame ads or pricing for a problem that really lives in the customer journey.
There’s also a practical shift happening in how merchants should measure performance. Standard dashboards show the broad outcomes. They don’t always show the micro-events that shape those outcomes, such as what questions appeared right before an abandonment, which product pages triggered the most hesitation, or whether buyers who engaged with support converted differently from buyers who didn’t.
That’s where KPI discipline pays off. Once you track the right signals, you can redesign product pages, change offer structure, tighten checkout, improve support coverage, and adjust paid traffic expectations with more confidence.
Understanding the Three Types of E-Commerce KPIs
The easiest way to make KPI tracking useful is to sort metrics by the business question they answer. Otherwise, merchants open Shopify analytics, GA4, ad platforms, and support tools, then drown in disconnected charts.
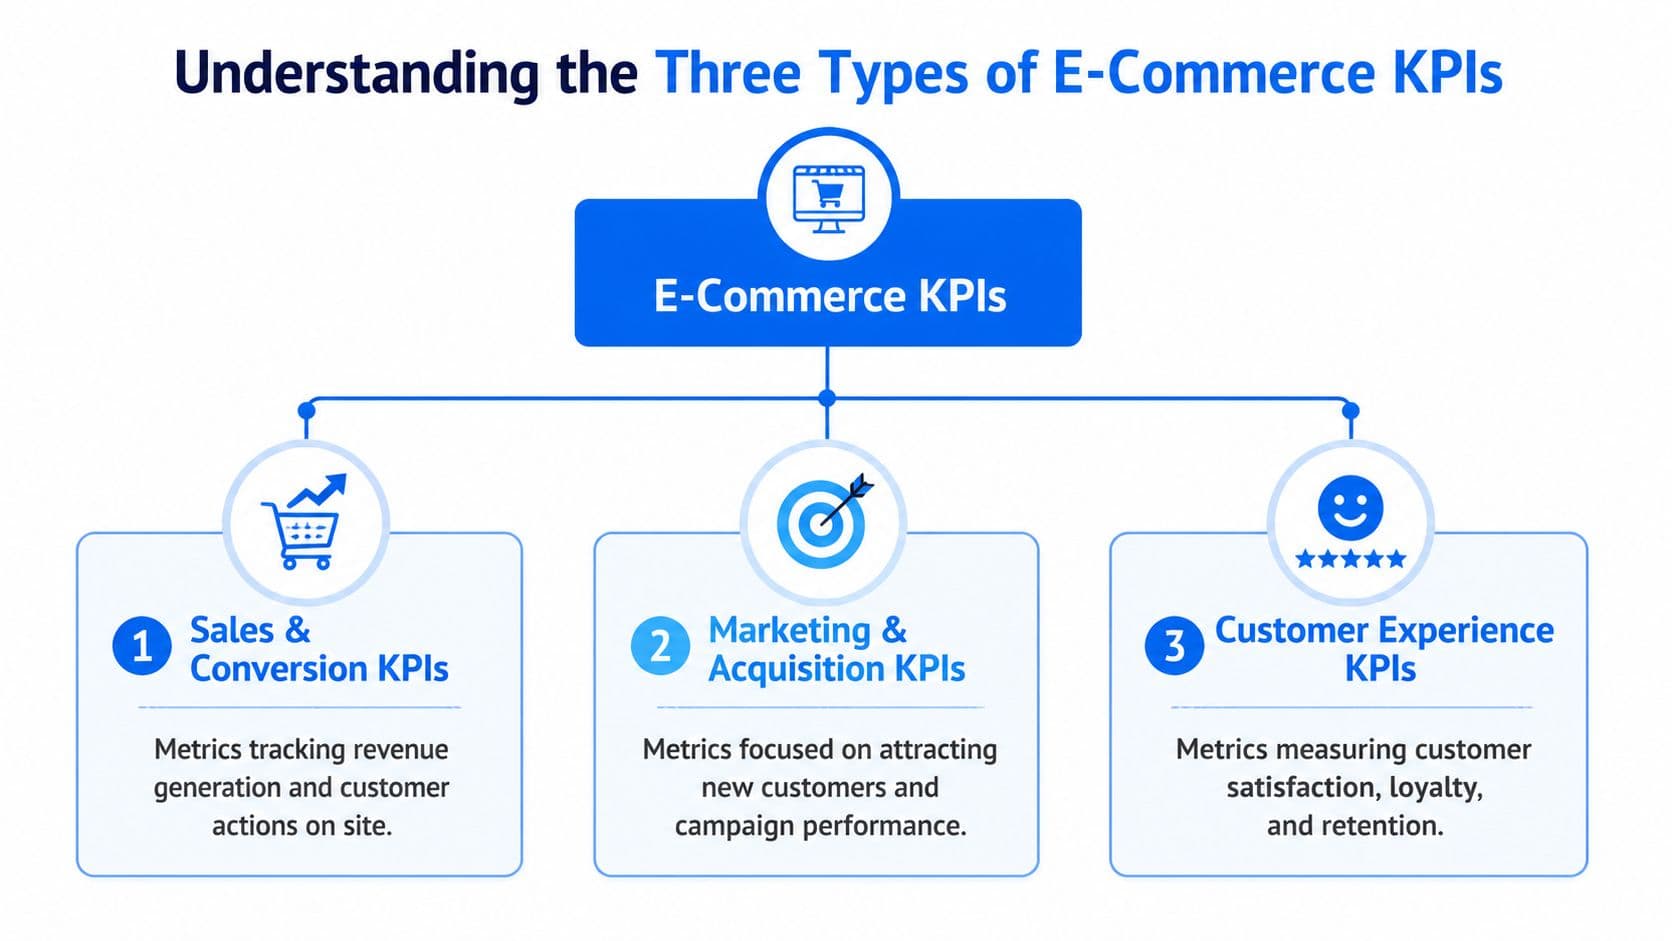
Sales and conversion KPIs
These are the scoreboard metrics. They tell you whether the store is producing revenue efficiently from the traffic it already gets.
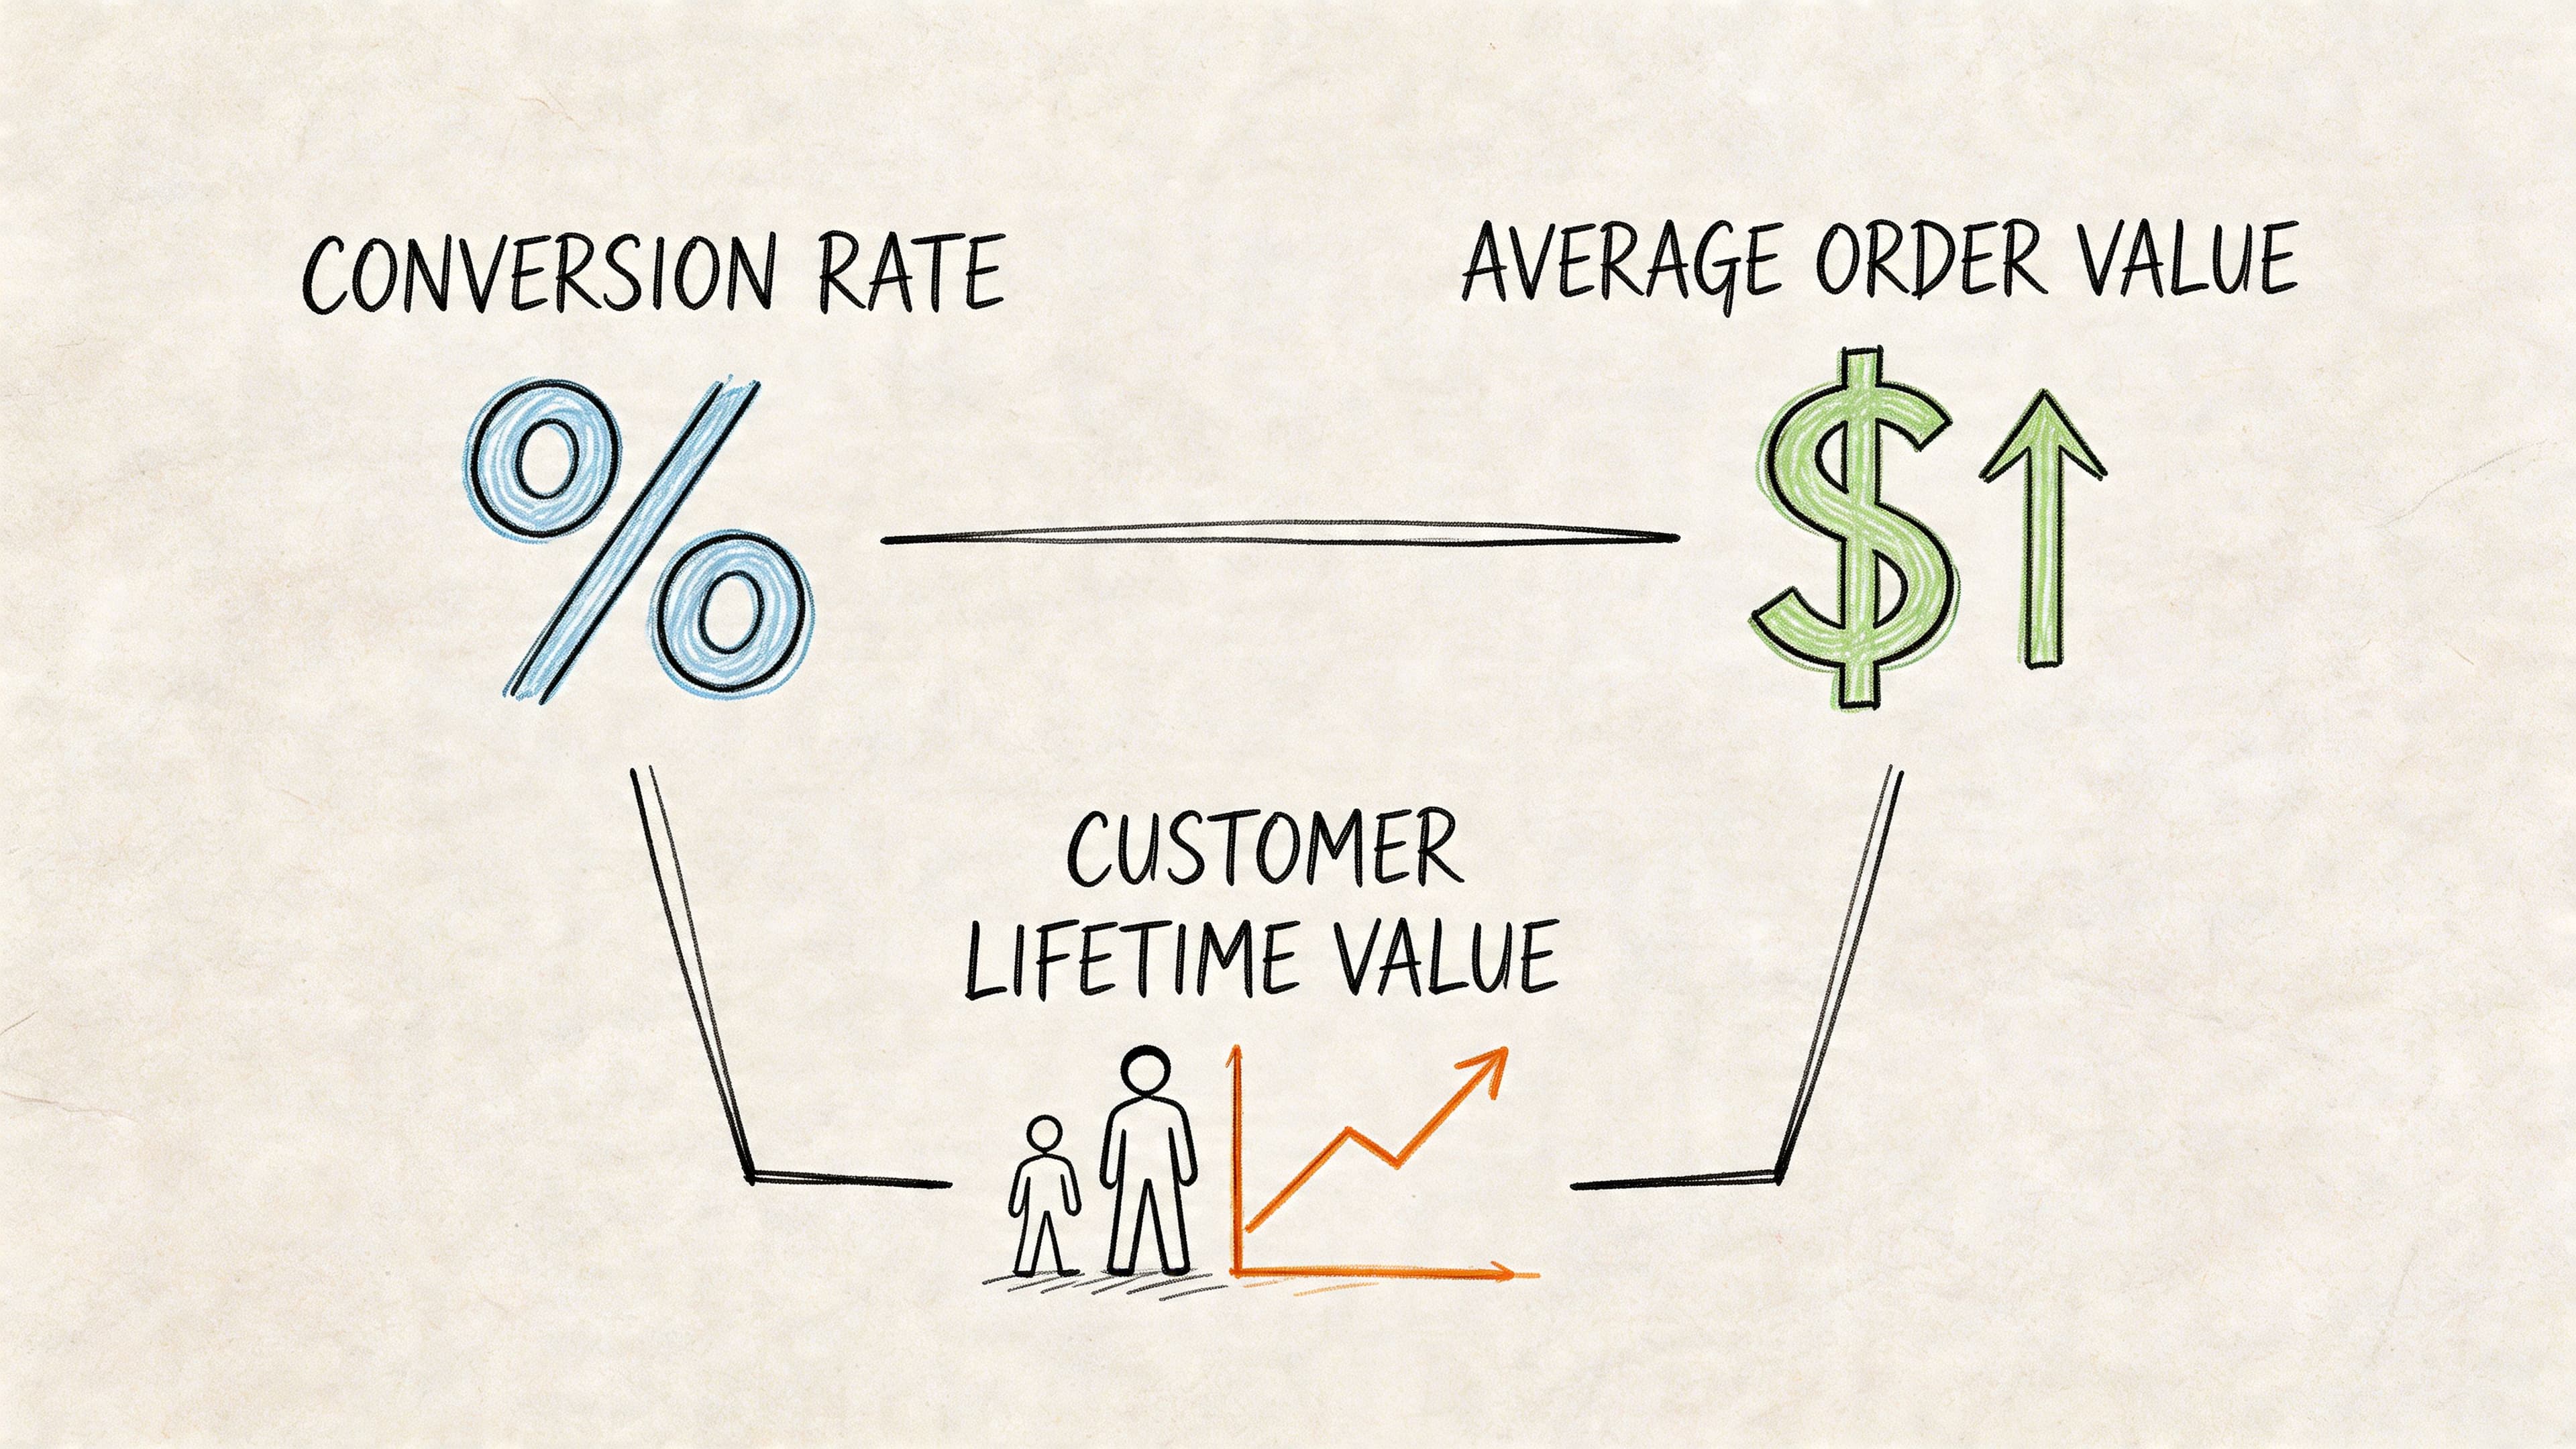
Think of this group as your commercial output layer. Conversion rate, average order value, and customer lifetime value belong here because they reveal whether the business model is strengthening or stalling. These are often lagging indicators. They tell you what happened after buyers moved through the funnel.
Marketing and acquisition KPIs
This category answers a more uncomfortable question. Are you paying too much to get attention that doesn’t convert?
Customer acquisition cost and return on ad spend sit here. They help you judge channel efficiency, campaign quality, and landing-page fit. But these metrics are only partly owned by the ad account. The onsite experience heavily influences them.
Paid traffic doesn’t fail only in Meta or Google. It often fails on the product page.
Customer experience KPIs
These are your early warning signs. They reveal whether the store feels easy, trustworthy, and clear to shop from.
Cart abandonment rate, first response time, resolution rate, and loyalty indicators belong in this group. These are often leading indicators because they show what’s likely to influence revenue before the final purchase outcome lands.
Here’s the practical difference:
| KPI type | Core question | What it helps you decide |
|---|---|---|
| Sales and conversion | Are visits turning into revenue? | Pricing, merchandising, bundles, checkout focus |
| Marketing and acquisition | Are we buying growth efficiently? | Budget allocation, campaign targeting, landing page quality |
| Customer experience | Are shoppers getting stuck or losing trust? | Support coverage, policy clarity, onsite guidance |
A balanced dashboard pulls from all three. If you only watch sales metrics, you react too late. If you only watch acquisition metrics, you can scale unprofitable traffic. If you ignore experience metrics, you miss the friction that keeps conversion weak even when products and ads are strong.
Core Sales KPIs for Measuring Profitability
Sales KPIs sit closest to cash. They show whether traffic, product interest, and buyer intent are turning into profitable orders.
Conversion rate tells you where revenue starts
Conversion rate is the percentage of visitors who complete a purchase. The formula is simple: (Total Transactions / Total Visitors) x 100.
As noted earlier, average storewide conversion rates usually sit in the low single digits. That is why this KPI deserves daily attention. On a Shopify store with steady traffic, a small gain here can produce more revenue than another week of ad spend.
Conversion rate usually improves when you remove hesitation at the point of decision. Shoppers stall because they cannot confirm delivery timing, return terms, sizing, compatibility, subscription details, or which variant fits their need. Those are not minor support questions. They are purchase blockers.
An AI chatbot can improve the metric directly. A tool like Carti can answer product questions in real time, recommend the right item, explain shipping and returns, and keep the shopper from leaving the page to hunt for basic information. If you track conversion rate after chatbot conversations versus sessions without engagement, you can see whether the bot is reducing friction or just creating noise.
Do not stop at the blended storewide number. Break conversion rate out by traffic source, device, landing page, and product category. Paid social traffic often needs more education. Branded search traffic usually needs speed and reassurance. Mobile PDPs often fail for different reasons than desktop collection pages. A Shopify dashboard mockup for this section should make that visible at a glance, with conversion tiles by channel and a trendline for sessions that interacted with the chatbot versus those that did not.
Working rule: Treat low conversion as a diagnosis problem. Find the unanswered question, then fix it.
AOV changes revenue without needing more traffic
Average order value, or AOV, tells you how much shoppers spend per order. The formula is Revenue / Number of Orders.
AOV is one of the cleanest ways to grow revenue because it does not depend on buying more visits. But there is a trade-off. Push too hard with irrelevant bundles or aggressive threshold offers, and conversion rate drops. I see this often on Shopify stores that add generic cart upsells without checking whether shoppers accept them.
The better approach is contextual merchandising. Recommend products that logically belong together, surface the right upgrade at the right moment, and explain why the add-on is useful. An AI chatbot can do that in conversation. If a shopper asks whether a serum works for sensitive skin, the bot can recommend the matching moisturizer. If someone is comparing two products, the bot can steer them toward the higher-value option when the fit is genuine.
That makes AOV more measurable and more actionable. Review attach rate, upsell acceptance, and AOV by chatbot-assisted orders versus standard orders. If the bot is increasing basket size but hurting checkout completion, pull back. If it is lifting both, expand those flows to your highest-traffic PDPs and cart pages.
This video gives a useful overview of the metrics relationship.
CLTV shows whether your store is building a business or chasing orders
Customer lifetime value, often written CLTV or LTV, estimates the value a customer brings across their relationship with your brand. Teams calculate it in different ways, but the job of the metric stays the same. It tells you how much you can spend to acquire and retain customers while still protecting margin.
CLTV improves when the first order feels easy, accurate, and worth repeating. Product recommendations have to be relevant. Delivery expectations have to be clear. Post-purchase questions need fast answers. Stores that separate support from revenue analysis miss the connection. A buyer who gets quick, accurate help is more likely to buy again.
AI support can affect CLTV earlier than many operators expect. If Carti answers pre-purchase questions correctly, reduces wrong-item purchases, and handles common post-purchase requests without delay, repeat purchase probability usually improves. The KPI to watch is not just overall LTV. Look at repeat purchase rate and time to second order for customers who interacted with the chatbot versus those who did not. That is where the retention signal shows up first.
Read these three KPIs together:
- Low conversion, low AOV usually points to friction plus weak merchandising.
- Healthy conversion, weak AOV usually points to poor product pairing, weak upsells, or an offer structure that leaves money on the table.
- Strong first-order metrics, weak CLTV usually points to a retention gap, poor post-purchase experience, or low product fit.
That is how profitable measurement works in practice. Conversion rate shows whether shoppers can buy. AOV shows whether the basket is being built well. CLTV shows whether the first order was the start of a customer relationship or just a one-time transaction.
Marketing and Acquisition KPIs for Smart Spending
Marketing KPIs answer a question every operator should ask before increasing budget. Are we buying efficient growth, or are we paying to send people into a weak experience?
CAC gets worse when your site wastes paid clicks
Customer acquisition cost, or CAC, is the cost to acquire a new customer. In plain terms, it tells you whether your growth engine is too expensive for the quality of buyers it produces.
Teams often attribute CAC to ad auctions, creative fatigue, or targeting decay. Those things matter. But onsite friction can subtly make CAC worse even when the ad account looks healthy. If buyers click with intent and then stall on the product page or checkout, your acquisition cost rises because fewer paid visits turn into customers.
The relationship between speed and conversion is direct. A 1-second page load delay can cause a 7% drop in conversions, and proactive interventions like AI-driven nudges can recover 10-15% of carts that would otherwise be lost, according to this e-commerce KPI breakdown. That’s why paid landing pages deserve extra scrutiny. Slow pages and unanswered questions turn expensive traffic into wasted spend.
A few fixes usually outperform broad campaign tinkering:
- Tighten landing page relevance so ad promise and product page content match.
- Reduce hesitation points by answering policy and product questions where intent is highest.
- Prioritize speed on paid traffic paths because delay compounds acquisition cost fast.
ROAS improves when campaign intent matches onsite experience
Return on ad spend, or ROAS, tells you how much revenue you generate for ad dollars spent. It’s useful, but it gets misread all the time.
A channel can show acceptable ROAS while still bringing in weak customers. Another can look soft at first purchase while feeding stronger repeat behavior. That’s why ROAS should sit next to downstream store metrics, not above them.
The strongest use of ROAS is comparative. Which campaign themes bring in buyers who convert cleanly, ask fewer pre-purchase questions, and move through checkout with less friction? When you combine ad data with onsite behavior, patterns show up quickly. Some campaigns need better product pages. Others need clearer policy placement. Some attract curiosity instead of purchase intent.
Here’s the trade-off merchants miss. Better acquisition isn’t only about lowering click costs. It’s about preserving the value of every click after it lands. If your store gives fast answers and directs paid visitors toward the right products, marketing efficiency improves without needing a dramatic creative overhaul.
Customer Experience KPIs for Building a Loyal Brand
A lot of revenue problems start as experience problems. The customer doesn’t think in departments. They don’t separate merchandising, support, and checkout. They experience one store, one journey, one decision.
Cart abandonment is an experience signal first
The clearest example is cart abandonment rate. It measures the share of shoppers who start checkout but leave before purchasing.
The headline number is severe. Cart abandonment rate averages 70% globally, and major drivers include unexpected costs (55%) and complex processes (28%), according to this e-commerce KPI analysis. That’s not just a checkout metric. It’s a trust and clarity metric.
When a shopper abandons, the issue is often obvious in hindsight. Shipping wasn’t clear. Return terms felt risky. The checkout asked for too much work. Or the buyer had one unanswered question and no quick path to confidence. If you want practical tactics for that part of the funnel, this guide on reducing cart abandonment with live chat on Shopify is a useful reference point.
A better way to use this KPI is to pair it with qualitative signals:
- Read pre-purchase chats to find recurring objections.
- Review checkout drop-offs by device to spot mobile-specific friction.
- Audit surprise costs because buyers react badly to late fees and unclear shipping.
A high abandonment rate usually means the store asked the buyer for trust before earning it.
Support KPIs influence repeat buying
Support metrics can look operational, but they have direct commercial value. First response time tells you how quickly shoppers get help. Resolution rate tells you whether they got what they needed.
Fast answers matter most before the sale, not after. If a buyer is comparing products and can’t get an immediate answer, they don’t open a ticket and wait patiently. They leave. Stores that treat support as a back-office function often miss how many purchases depend on immediate reassurance.
For Shopify merchants, the practical lesson is simple. Measure support where it intersects with revenue. Track which questions appear most often before conversion, which pages trigger them, and whether response coverage exists outside business hours.
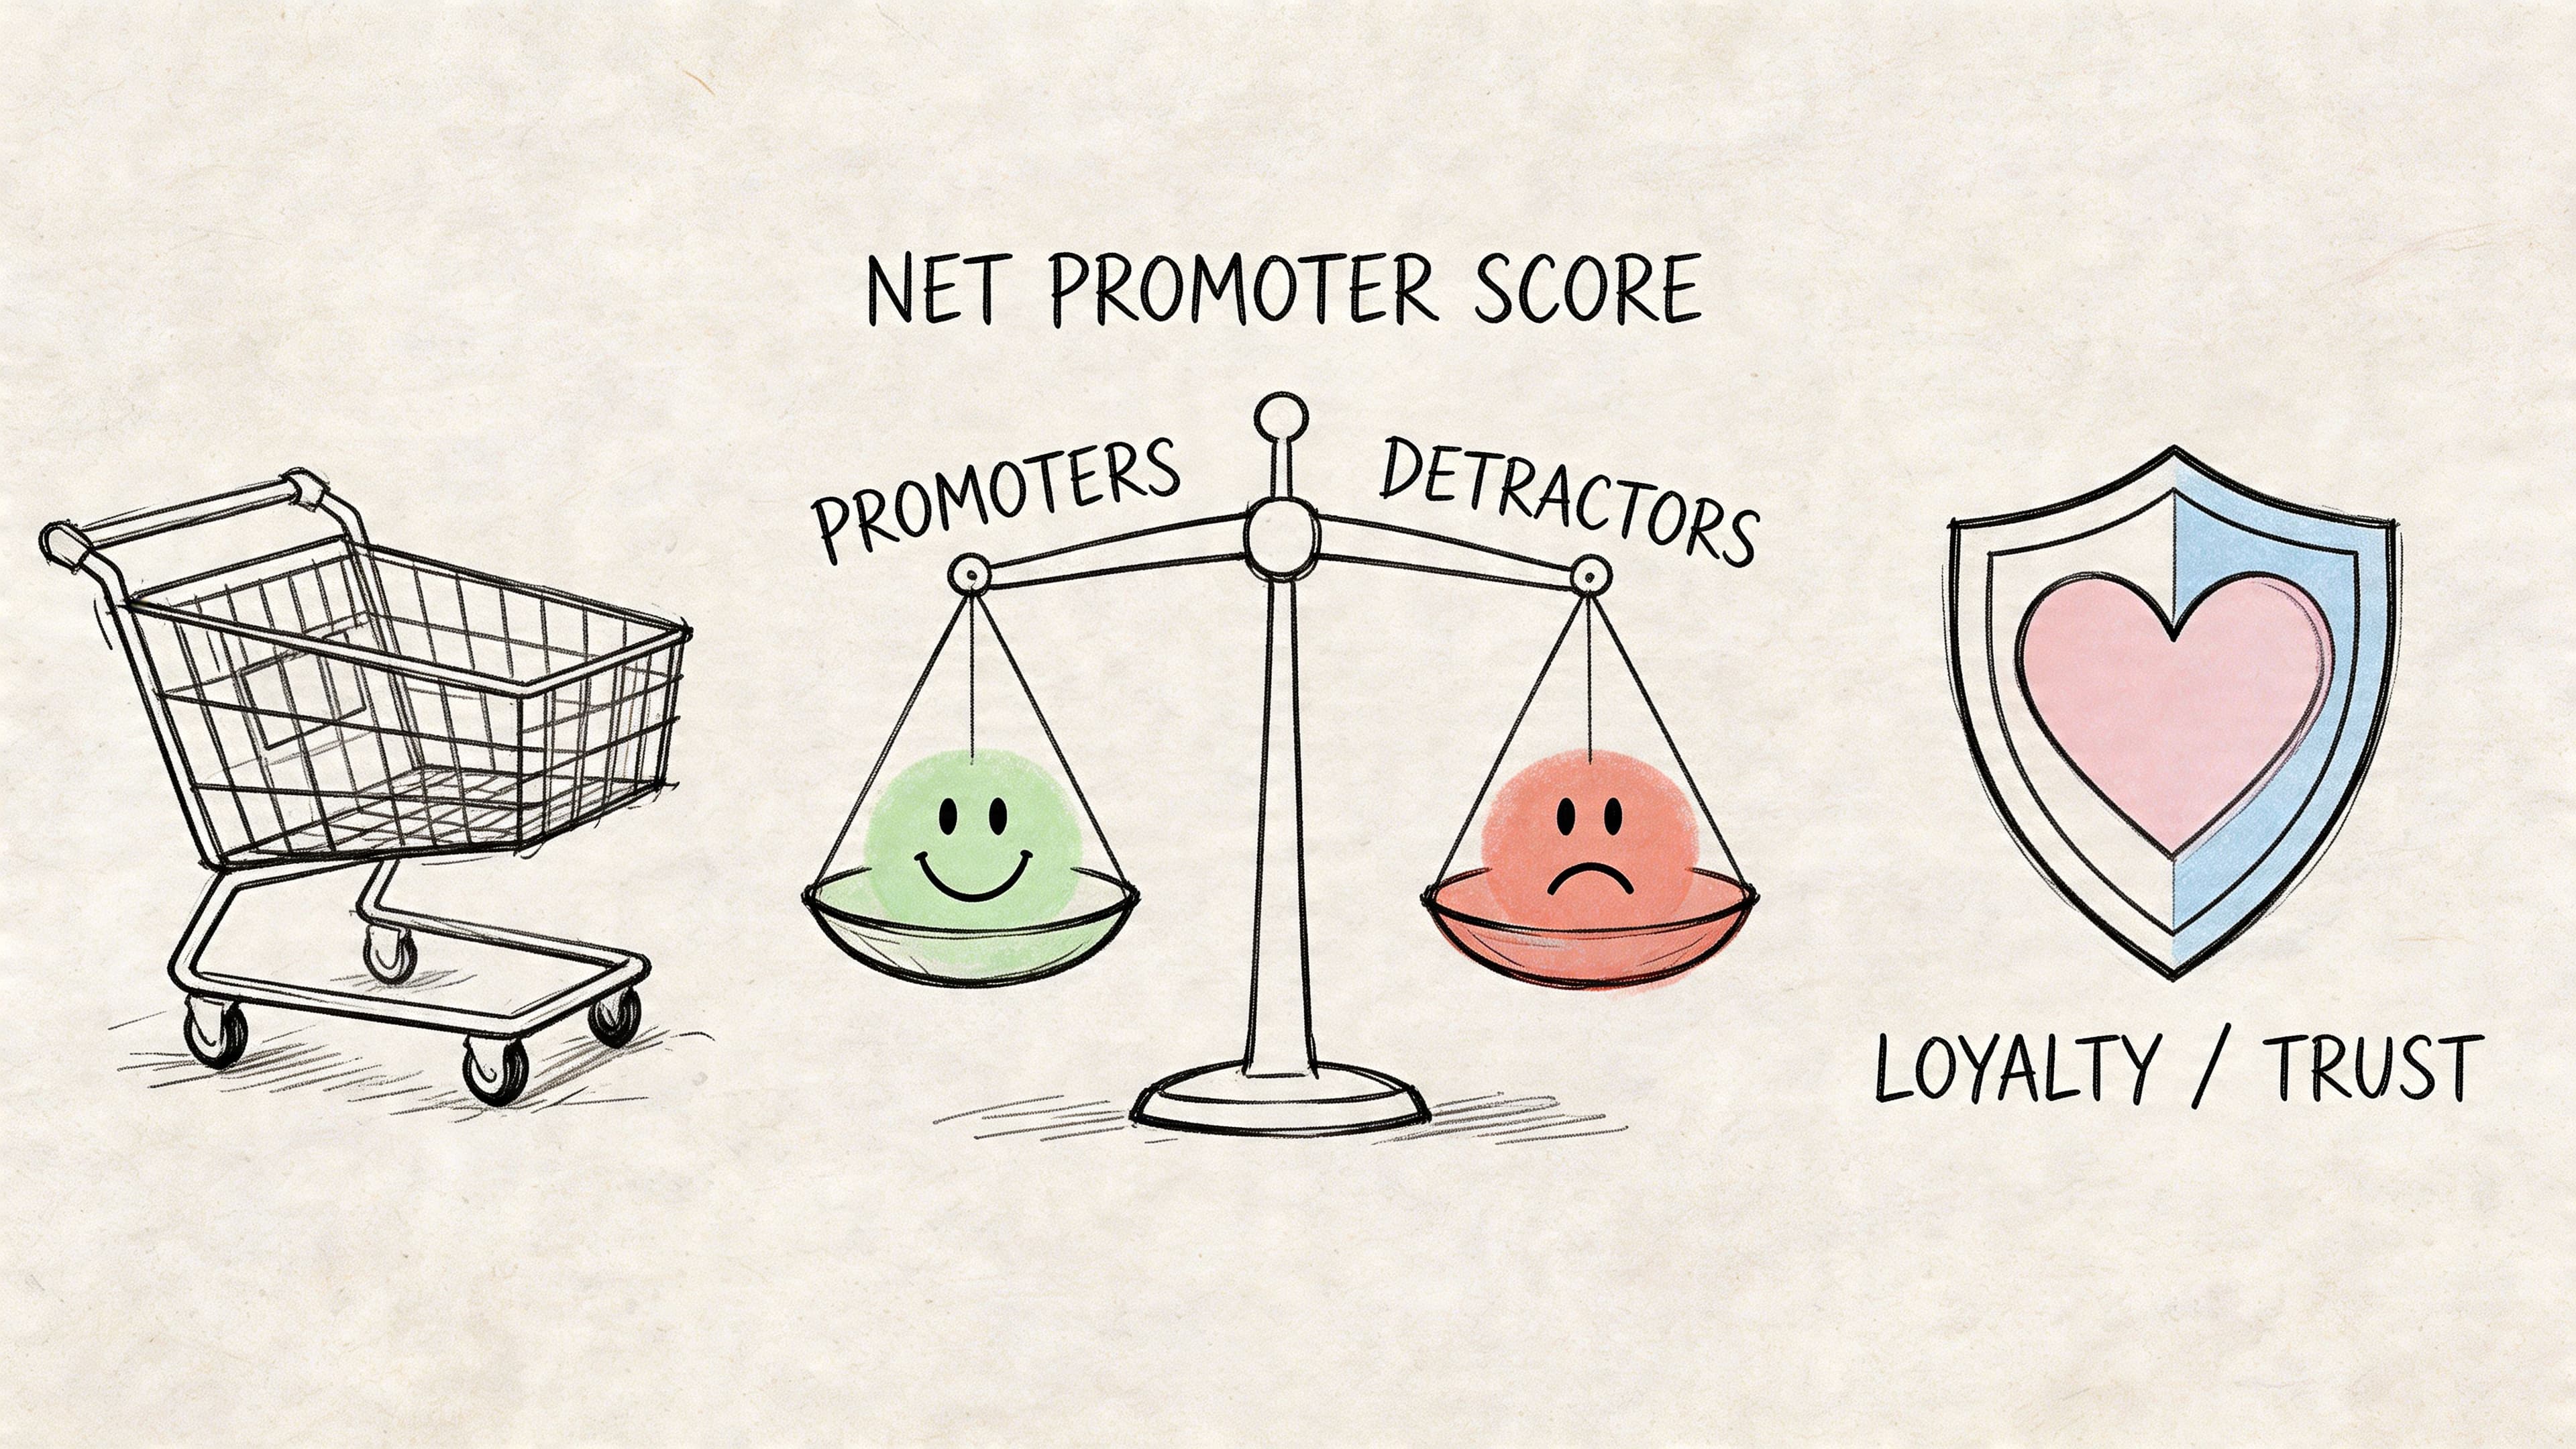
NPS is useful when tied to operational fixes
Net Promoter Score, or NPS, is helpful when it triggers action. On its own, it’s only a sentiment label. The value comes from connecting promoter and detractor feedback to operational decisions.
If detractors repeatedly mention delivery confusion, update shipping messaging. If promoters mention helpful guidance, preserve that experience and scale it. If buyers praise easy product discovery, look at the product pages, recommendations, and support flows that made that happen.
That’s the larger point. Customer experience KPIs shouldn’t live in a separate tab owned by support. They belong in the revenue conversation because loyalty starts long before the second purchase.
Building Your Shopify KPI Dashboard
Stores that check KPIs in separate tabs usually react too late. A useful Shopify dashboard puts the numbers that move together on the same screen, so you can spot the cause of a drop before it costs another day of sales.
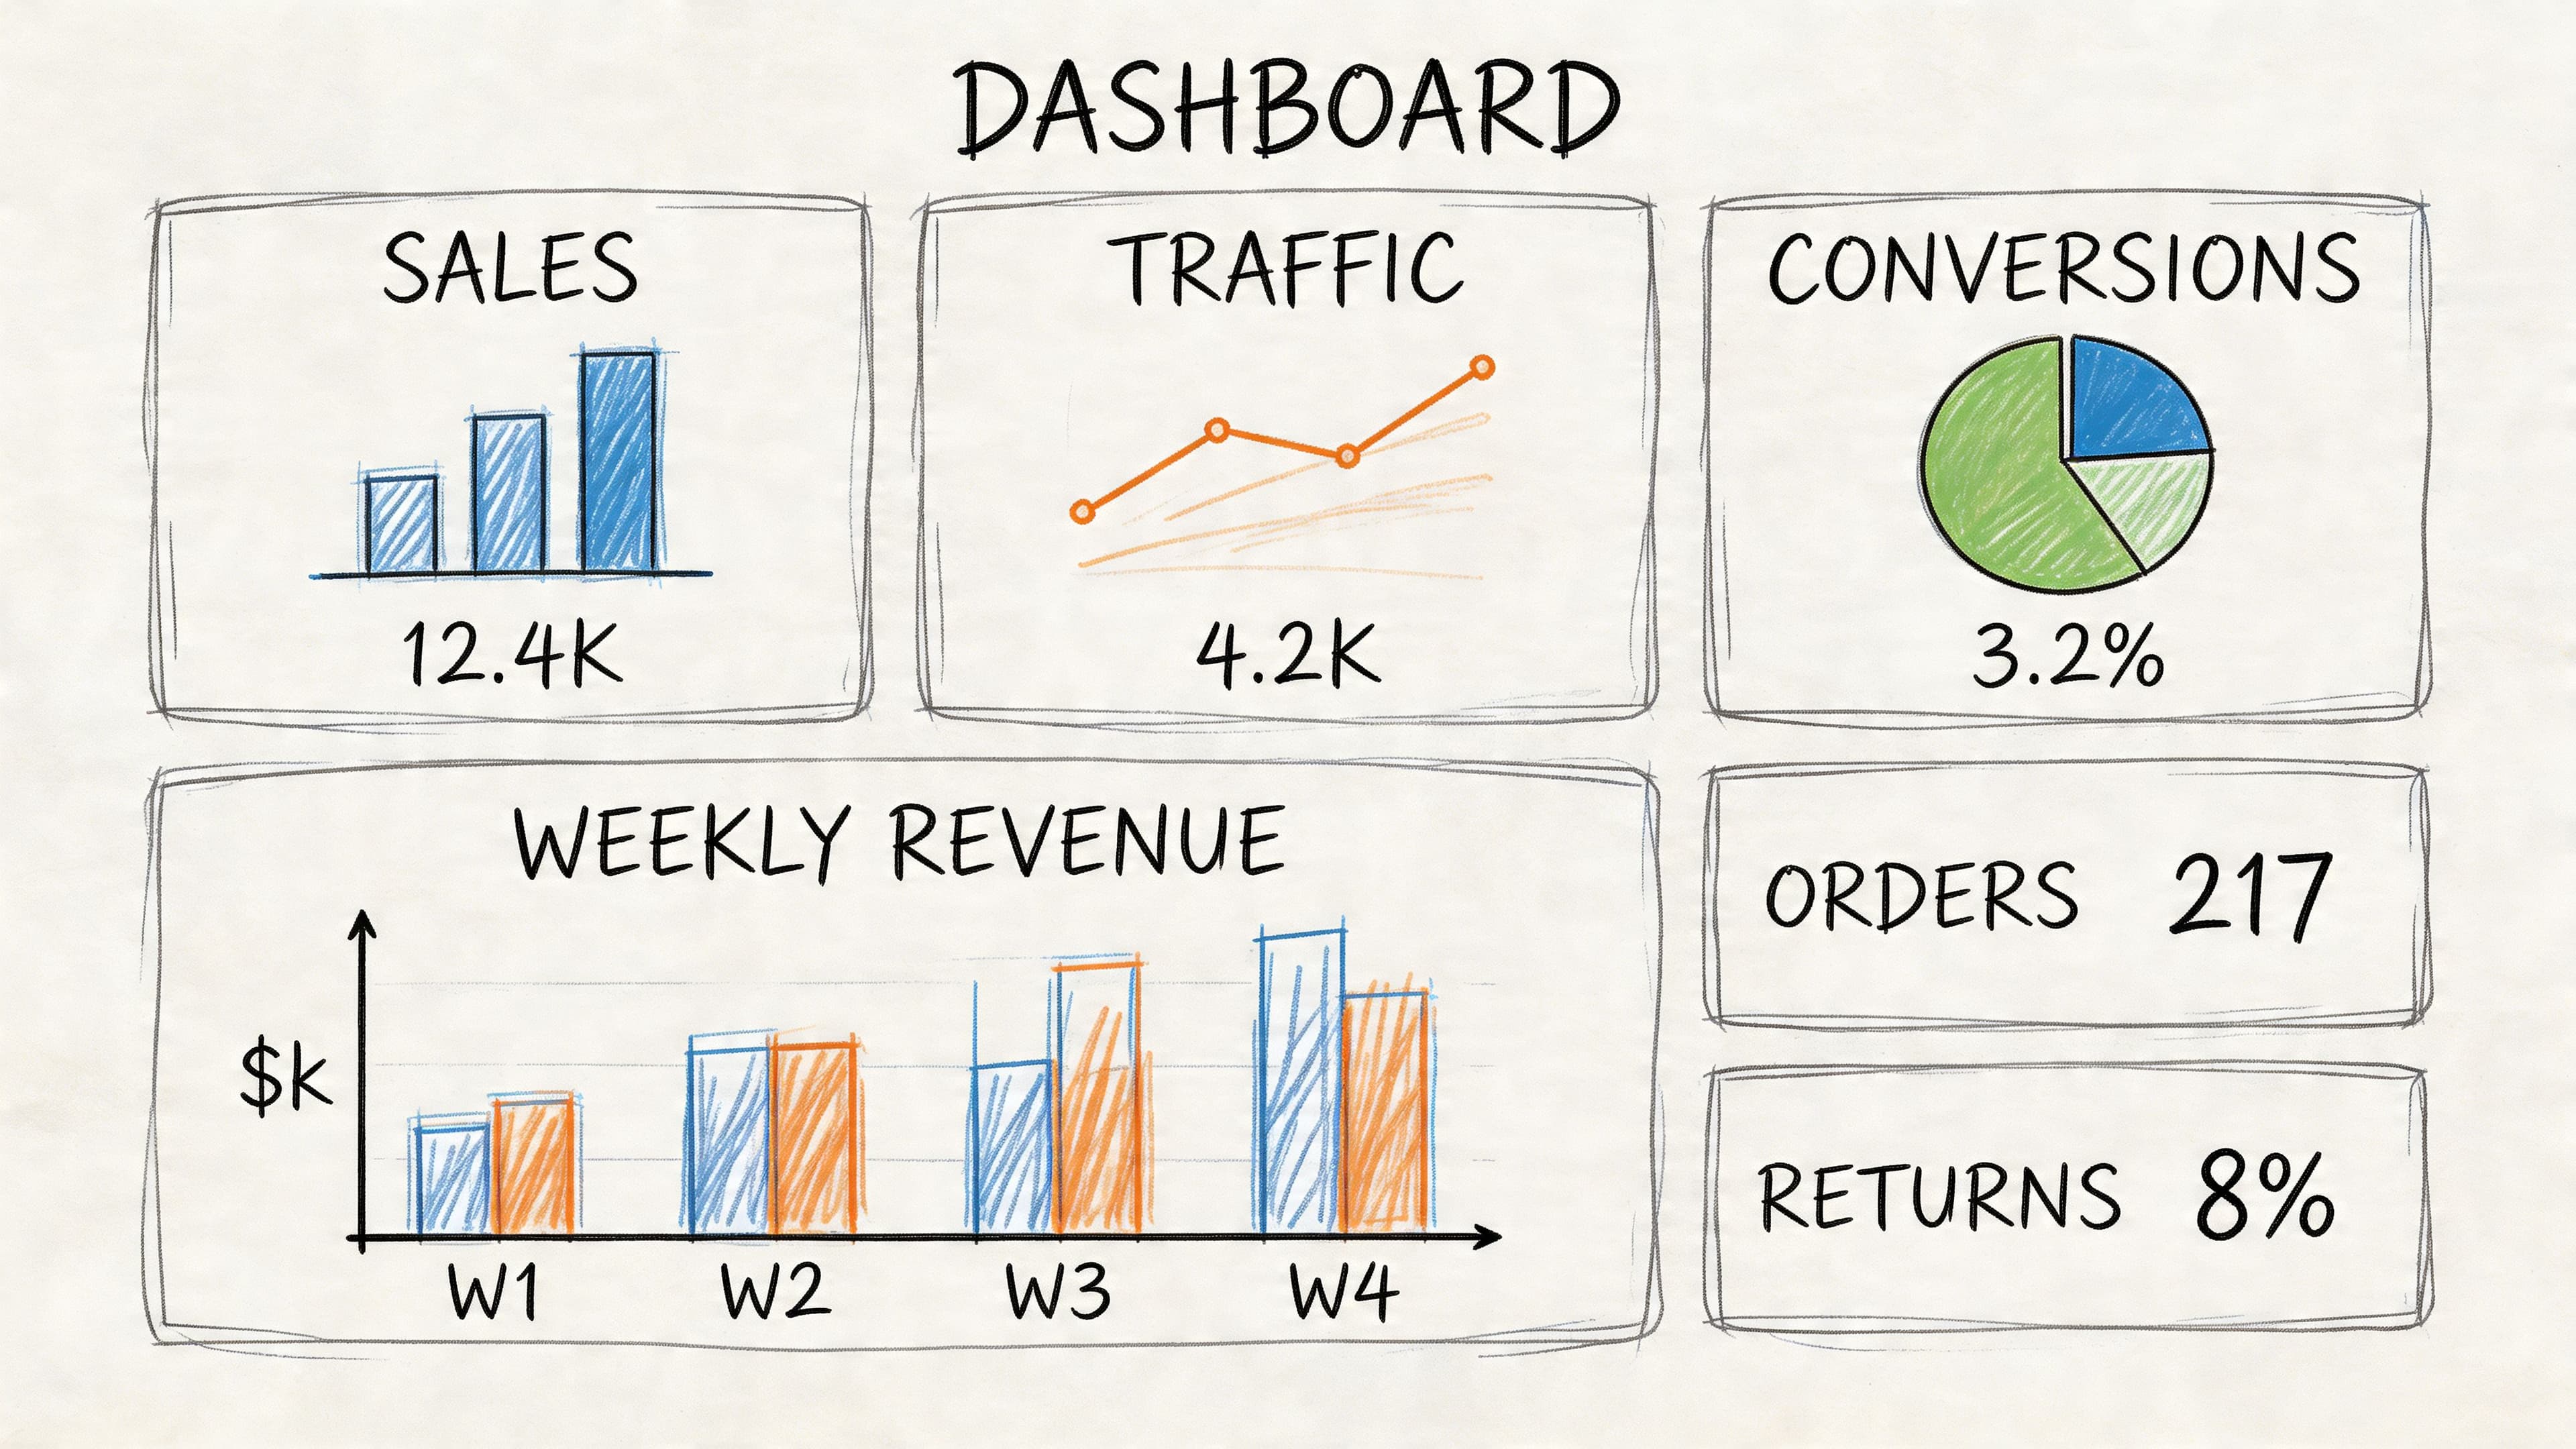
A practical dashboard layout
Start with the outcome metrics that matter to margin. Put conversion rate, AOV, and revenue in the top row. Read them together, not one by one. If revenue is up but AOV is down, discounting may be doing the work. If traffic climbed and revenue stayed flat, the problem is usually conversion quality, not reach.
The second row should explain acquisition efficiency. Pair traffic by source with CAC and ROAS so paid and organic performance can be judged in context. This helps separate a traffic problem from a landing-page problem. It also stops a common mistake. Cutting ads when the actual issue sits on the product page or in the cart.
The third row should focus on buyer friction inside the store. Use cart abandonment, top pre-purchase questions, chat engagement by page type, and repeat purchase rate. That turns the dashboard into a decision tool instead of a reporting screen. If product pages for one collection trigger a high volume of sizing questions, the next step is clear. Fix the page, train the chatbot on the answer, and watch whether conversion improves.
A simple structure looks like this:
| Dashboard area | What to include | Why it matters |
|---|---|---|
| Revenue snapshot | Conversion rate, AOV, revenue | Shows whether growth came from more buyers, bigger baskets, or both |
| Acquisition efficiency | Traffic by source, CAC, ROAS | Shows whether demand is profitable by channel |
| On-site friction | Cart abandonment, pre-purchase question trends, engagement by page type | Shows where buyers hesitate before checkout |
Chatbot KPIs that deserve a permanent spot
Standard KPI guides usually stop at traffic, conversion, and revenue. That leaves out the part of the funnel where AI chat can directly change the result. For a Shopify store using a tool like Carti, the dashboard should show how chatbot interactions influence purchases, recover carts, and expose missing information on the site.
Four metrics matter most:
- Chatbot-assisted conversion rate tracks orders that included a pre-purchase chat interaction. This shows whether the bot is helping buyers choose and move forward, not just answering questions.
- Real-time cart recovery success rate measures how often an automated prompt brings a shopper back to checkout after exit intent or hesitation.
- Question trend by product or page shows which objections repeat often enough to justify a merchandising fix.
- Containment rate with revenue context shows how many conversations the bot resolves without handing off, while still protecting conversion and customer satisfaction.
These metrics matter because they connect AI features to store growth. Product recommendation flows should raise chatbot-assisted conversion rate. Cart reminders and checkout nudges should improve recovery. FAQ automation should reduce repetitive support demand, but only if conversion holds steady or improves.
That trade-off matters. A high containment rate looks efficient, but if the bot contains too aggressively and shoppers still leave, the store saves support time while losing revenue. The right dashboard makes that visible.
If you want to estimate the financial upside before changing your setup, use this Shopify ROI calculator for conversion and cart recovery.
Track chatbot KPIs like sales and merchandising metrics, because that’s what they are.
Turn Your Data Into Dollars
The point of tracking e commerce key performance indicators isn’t to build prettier reports. It’s to make faster, better decisions with less guesswork.
If your sales KPIs are weak, start where buyers hesitate. Improve product clarity, tighten merchandising, and remove friction from the path to purchase. If marketing KPIs look expensive, don’t just cut budget. Check whether your landing experience is wasting intent after the click. If customer experience KPIs are flashing red, treat that as a revenue issue now, not a support cleanup task later.
The strongest operators use KPIs as a loop. They measure, diagnose, change one thing, and watch the result. They don’t chase every metric. They choose a short list that matches how their store grows.
A practical weekly review looks like this:
- Check sales efficiency by reading conversion rate beside AOV.
- Audit paid traffic quality by comparing acquisition metrics with onsite behavior.
- Scan experience friction through cart abandonment and recurring shopper questions.
- Turn repeated objections into fixes on product pages, policy pages, and checkout steps.
That’s also where modern AI support earns its place. Not as a novelty widget, but as a source of continuous buyer insight and a lever for conversion, recovery, and workload reduction. If you want a clearer framework for measuring that impact, this article on Shopify chat AI ROI metrics is worth reading.
Good KPI tracking gives you control. You stop managing the store by instinct alone and start improving it with evidence. That usually leads to better conversion, stronger retention, cleaner operations, and fewer fires for your team to put out.
If you want to turn KPI tracking into action, Carti helps Shopify stores answer shopper questions instantly, guide buyers to the right products, and recover carts in real time. It’s built for merchants who want stronger conversion data and less support workload, without a complicated setup.

Written by
Daniel AndersonFounder of Carti. 10+ years building ecommerce brands in apparel and supplements. Still runs a Shopify store and built Carti to help merchants convert more browsers into buyers.
Ready to boost your store's sales?
Install Carti in 5 minutes and let AI handle customer questions, recommend products, and close sales 24/7.
Start Free Trial14-day free trial