
You're probably sitting in Shopify admin right now, toggling between sales reports, traffic charts, ad dashboards, and maybe a spreadsheet your team doesn't trust. Traffic looked fine, then conversion slipped, and now everybody has a different explanation for the same problem. That's the usual sign you don't need another dashboard, you need a better decision system.
The Dashboard Trap Most Shopify Stores Fall Into
A merchant sees a clean-looking graph in one tab, a conflicting number in another, and a Slack thread starts because nobody can agree on whether the problem is traffic, checkout friction, or bad attribution. That's the dashboard trap. The issue usually isn't that the store lacks data, it's that the team has no staged plan for which tool answers which question.
Start with the question, not the software
Many teams shop for ecommerce analytics tools like they're buying insurance, collecting options until something feels safe. That's backwards. If you don't know whether you need cleaner tracking, better integration, or a warehouse-ready model, you'll just buy a prettier version of the same confusion.
The category exists because online retail needs a single reporting layer that blends traffic, conversion, revenue, and customer behavior instead of treating them as separate stories. Salesforce groups the core metrics around conversion rate, average order value, customer acquisition cost, customer lifetime value, website traffic, bounce rate, and product performance in its ecommerce reporting guidance, which is exactly why basic reports stop being enough once a store starts scaling or stalling. Salesforce's ecommerce analytics overview also makes the benchmark problem obvious, because a healthy store is often judged against a 2% to 4% conversion rate range.
Practical rule: if your team can't point to the exact event where shoppers drop, the dashboard is decorative.
Carti belongs in the behavior layer, not the vanity layer
Merchants usually overbuy. They reach for another reporting panel when the better move is a tool that turns onsite intent into action, especially when the problem is cart abandonment, unanswered questions, or weak product discovery. Carti fits that behavior-driven layer because it turns shopper signals into support, recommendations, recovery nudges, and merchandising feedback, which is closer to revenue work than another generic chart.
The operating habit to build is simple. First define the question, then decide whether Shopify Analytics, GA4, a behavioral tool, or a warehouse stack can answer it cleanly. If not, add the next layer only where the current stack breaks.
What Ecommerce Analytics Tools Actually Do
At their core, ecommerce analytics tools are reporting systems that unify store traffic, sales, and shopper behavior into one view. They used to be closer to pageview counters. After the shift toward event-based measurement, they became tools that can follow product views, add-to-cart actions, checkout steps, and completed purchases across web and app journeys. Google Analytics 4 reflects that shift with event-based ecommerce tracking, while Shopify Analytics keeps native reporting inside the merchant dashboard. Improvado's tool guide describes that evolution clearly.
The category by operating stage
| Operating Stage | Tool Archetype | What It Answers | Typical Cost |
|---|---|---|---|
| Early store | Free foundational analytics | What's happening on the site and which products move | Free or low cost |
| Growth store | Event-based analytics | Where shoppers drop and which campaigns or pages influence purchase | Free to mid-tier |
| Mature brand | Behavioral analytics | How cohorts behave over time and what drives repeat buying | Mid-tier to paid |
| Enterprise | Warehouse-native stack | What's true across channels, brands, and systems of record | Custom, often high cost |
That table is the useful way to think about the market. A free tool isn't “basic” if your store still needs clean event tracking and simple attribution. An enterprise platform isn't “better” if your team can't maintain it or feed it the right data.
The real definition is journey visibility
A working definition you can repeat internally is this, ecommerce analytics tools measure the full shopper journey, not just orders. That matters because order totals alone don't tell you whether the problem lives in traffic quality, merchandising, checkout, or fulfillment. The best tools move upstream and downstream from the sale so operators can see what happened before the purchase and what happened after it.
This is also why cost ranges matter. Free tools like Google Analytics 4 and Shopify Analytics make sense early. At the other end, tools like Adobe Analytics sit in enterprise territory and can cost around $100,000+ per year according to current tool comparisons. That isn't a badge of honor, it's a sign the platform is built for a different operating reality. Improvado's comparison and Salesforce's ecommerce analytics page both show why the “best” tool depends on stage, not branding.
The Five Metrics That Actually Drive Decisions
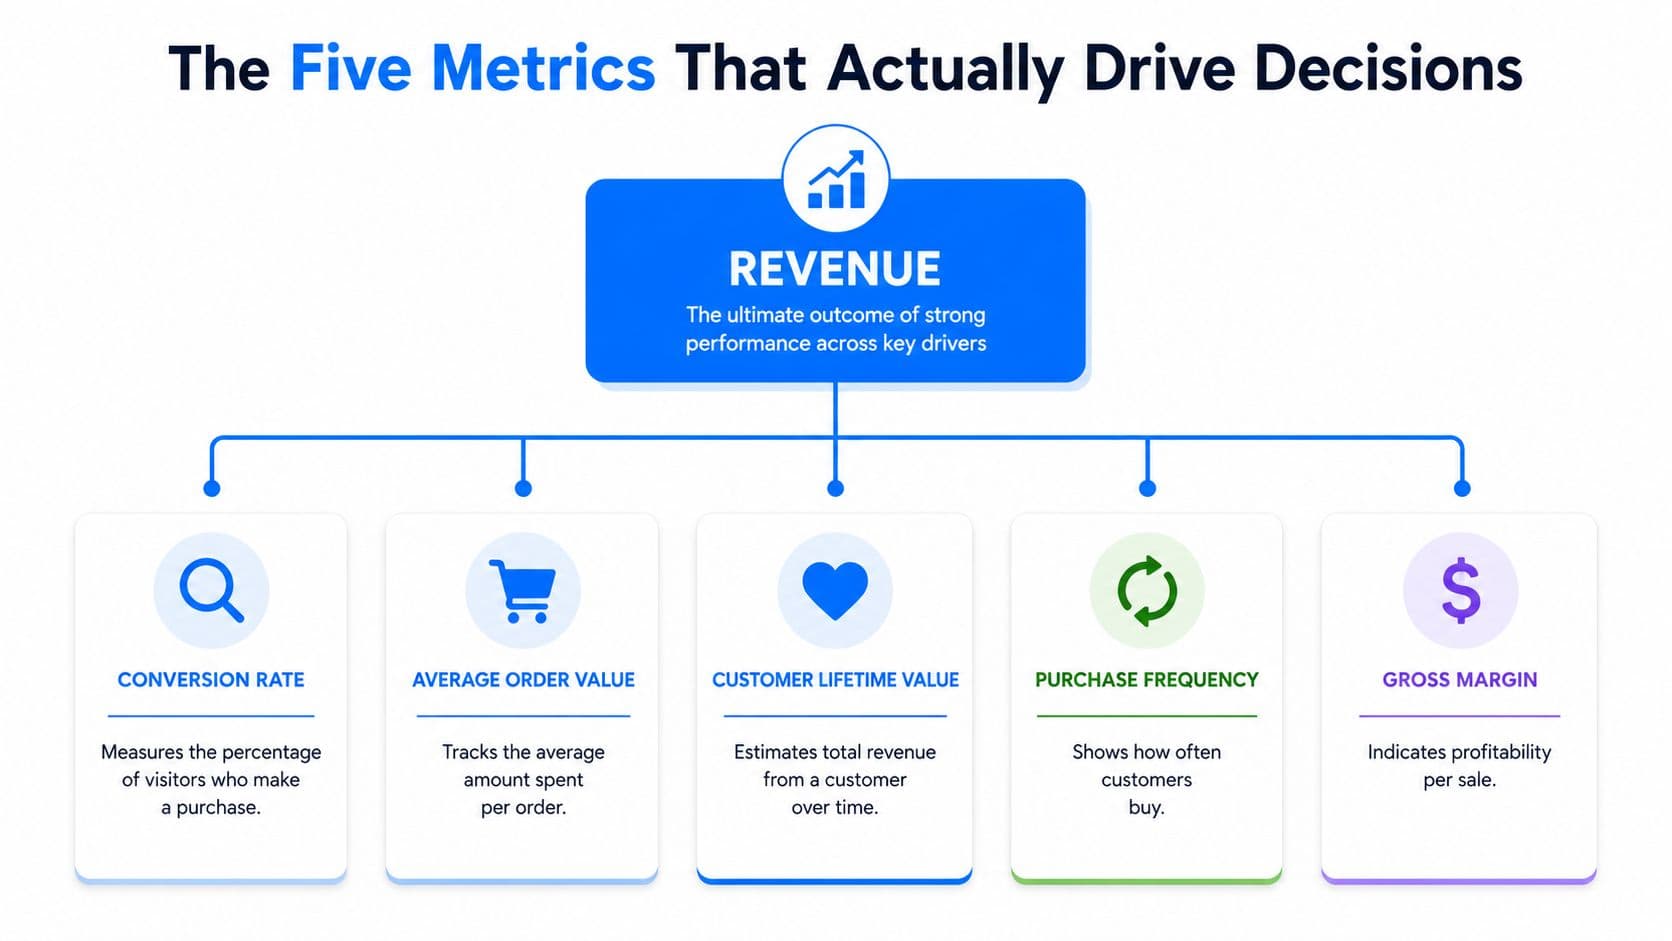
Most Shopify teams drown in metrics and still make decisions from only a handful. The five that matter are conversion rate, average order value, customer acquisition cost, customer lifetime value, and product or funnel performance. Everything else is secondary unless it changes one of those five.
Revenue starts with conversion, not traffic
Conversion rate is the first number to check when growth feels off. Salesforce notes that healthy ecommerce performance is often judged in the 2% to 4% range, which gives you a practical benchmark instead of a vague “looks okay.” Salesforce's ecommerce analytics overview is useful here because it ties the benchmark to actual store performance, not just traffic volume.
If conversion is weak, don't blame ads first. Look at product page clarity, trust signals, shipping friction, and checkout steps. If your analytics tool can't break conversion down by source, cohort, or funnel event, it's reporting, not analyzing.
The other four metrics decide how you spend
Average order value tells you whether bundles, upsells, and merchandising are doing their job. Customer acquisition cost tells you whether paid media is still worth the spend. Customer lifetime value tells you if repeat purchase behavior justifies deeper acquisition costs. Product and funnel performance tells you which SKUs and steps are helping or hurting the path to revenue.
Carti's KPI article is a useful companion if you want to translate metrics into a cleaner internal scorecard.
- Conversion rate: Use it to decide whether to fix traffic quality or on-site friction.
- Average order value: Use it to judge bundles, cross-sells, and upsells.
- Customer acquisition cost: Use it to cut waste in paid spend.
- Customer lifetime value: Use it to decide how aggressive you can be with acquisition.
- Product or funnel performance: Use it to retire weak products or repair a broken step.
Operator takeaway: if your dashboard can't connect those five metrics back to source, cohort, or funnel step, you're looking at noise.
The point isn't to track more. The point is to make each metric force a decision. That's what good analytics does, and it's what most reports fail to do.
The Four Types of Analytics Tools Every Shopify Merchant Should Know
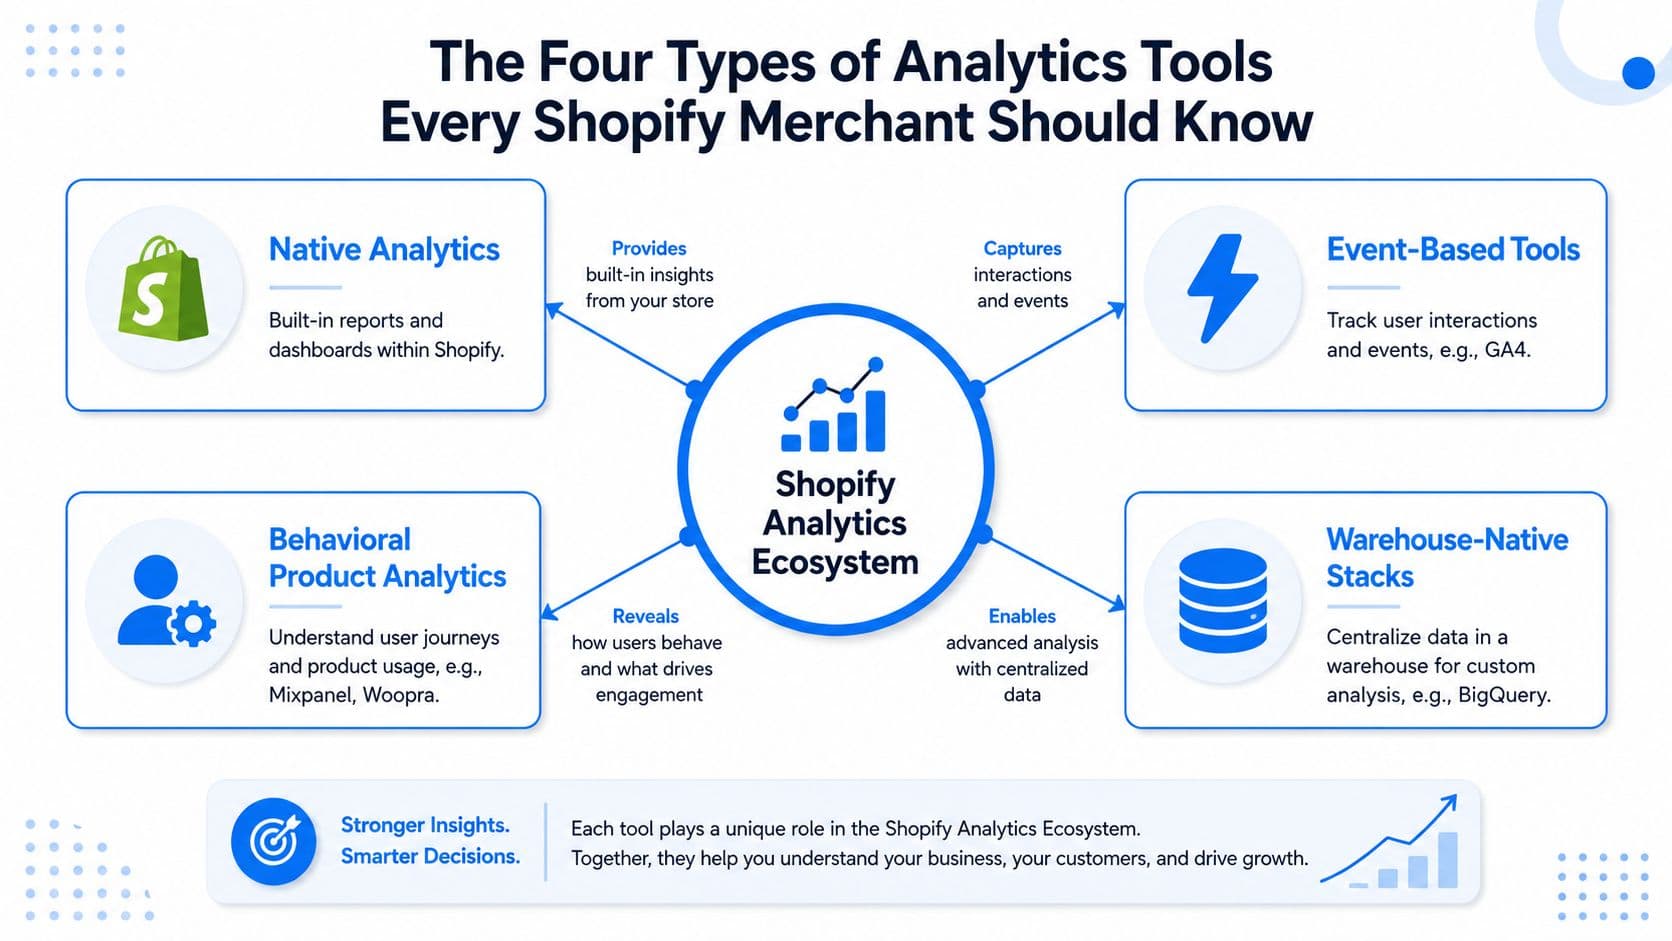
A lot of tool lists mash everything together, which is why merchants buy overlap instead of coverage. There are really four useful archetypes: native analytics, event-based tools, behavioral product analytics, and warehouse-native stacks. Each solves a different operating problem.
Native analytics is the baseline, not the finish line
Shopify Analytics lives inside the merchant dashboard and gives you native sales, conversion, customer, and product reporting. It's fast, familiar, and good enough for a lot of early-stage stores. Google Analytics 4 adds event-based behavior tracking, ecommerce reporting, audience segmentation, predictive metrics, and cross-platform insights, which is why it became the default framework for many merchants.
Use native analytics when you need clean answers quickly and your stack is still simple. Use GA4 when you need event-level behavior and downstream attribution. Improvado's guide and ReportDash's ecommerce analytics overview both reflect that split.
Behavioral and warehouse-native tools solve different jobs
Behavioral product analytics tools like Mixpanel and Woopra are for funnel depth, retention, and journey analysis. They're not ad attribution engines. They're better at showing how people move through a product or store over time.
Warehouse-native stacks sit at the top of the maturity curve. They're built when you need central truth across Shopify, ads, email, fulfillment, and CRM data, usually in BigQuery, Snowflake, or Redshift. That's where the model lives when reports start conflicting.
- Native analytics: Best for built-in reporting and quick checks.
- Event-based tools: Best for journeys, funnels, and behavior tracking.
- Behavioral product analytics: Best for cohorts, retention, and usage patterns.
- Warehouse-native stacks: Best for unified source-of-truth reporting.
Pricing helps signal fit. Industry comparisons place Mixpanel with a free tier handling up to 20 million events, Woopra with a free tier for 500,000 actions, Kissmetrics starting at $299 per month, and Adobe Analytics at roughly $100,000+ annually. Improvado's comparison is blunt about that spread, and merchants should be too. Don't pay enterprise money for a problem that native analytics already solves.
How to Wire Analytics Into Your Shopify Stack
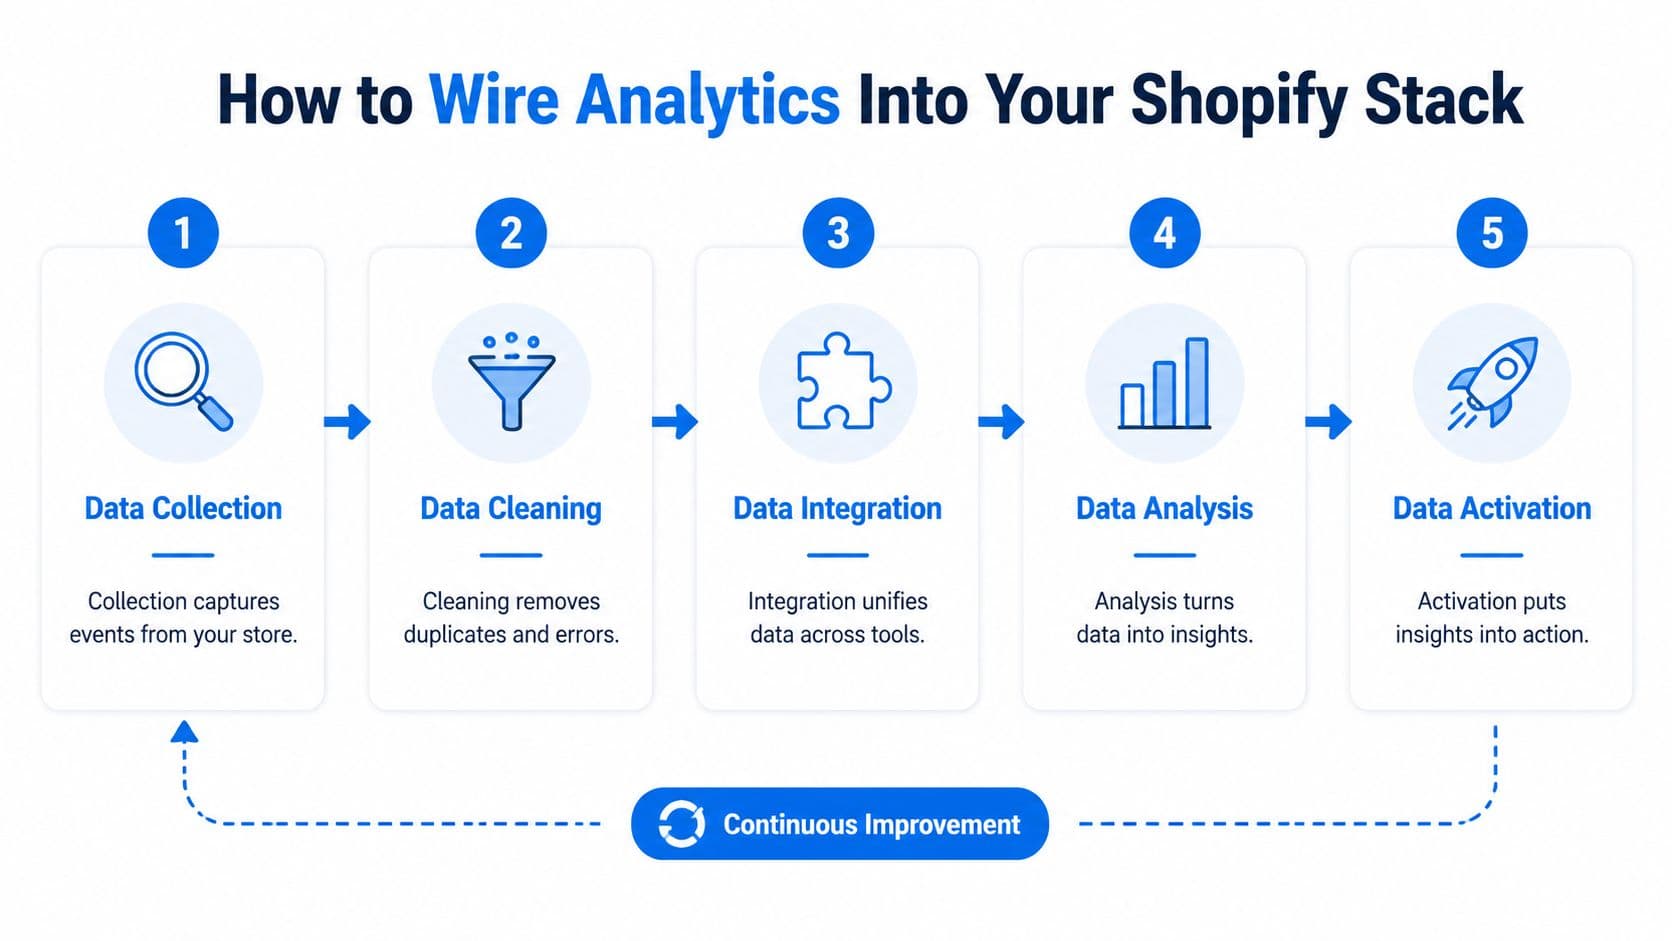
The stack breaks most often after the tool purchase, not before it. If you want reliable analytics, you need five integration layers, commerce platforms, ad networks, email and SMS, fulfillment and inventory, and data warehouses. The practical connectors commonly used include Shopify, WooCommerce, Meta Ads, Google Ads, TikTok Ads, Klaviyo, NetSuite, ShipBob, Snowflake, BigQuery, and Redshift. Basedash's ecommerce analytics comparison lays out why those connectors matter.
Build the stack in the right order
Start with clean tracking inside Shopify and GA4. Then connect your ad and email systems so you can compare what happened on site against what happened off site. Only after that should you push into a warehouse and build attribution or profitability modeling.
The reason is simple. Once order, ad-spend, and fulfillment data are joined at the warehouse level, you can attribute revenue more accurately, spot repeat-purchase curves, and catch stockouts or fulfillment lag before they hit conversion or lifetime value. That cause-and-effect is why warehouse work pays off for larger merchants and why spreadsheet reconciliation gets painful fast.
Use a staged upgrade path
- Stage one, clean tracking: Make sure events, UTMs, and orders match.
- Stage two, integration: Connect ad, email, and fulfillment data.
- Stage three, warehousing: Centralize data when manual exports start failing.
- Stage four, modeling: Add attribution and profitability only after source data is stable.
If you need a practical way to connect event tracking with your content or search workflow, connect GA4 with Keyword Kick shows how teams can wire analytics into broader operational use without treating it as a standalone island.
The store that reconciles order, ad, and fulfillment data every week will outlearn the store that only checks a dashboard after revenue drops.
The point isn't to create a bigger stack. It's to make each layer answer a different question without stepping on the same data twice.
What Most Tool Comparisons Get Wrong About Evaluation
Most comparison pages obsess over dashboards because dashboards are easy to sell. Operators care about whether the data stays accurate when APIs change, whether refreshes are current, and whether the tool can keep a clean source of truth across systems. Those are the actual failure points.
Ask about reliability, not just features
A good vendor call should cover connector durability, data freshness, source-of-truth consistency, and maintenance SLAs. If the platform depends on fragile API syncs, your reporting will drift the moment Meta, TikTok, Shopify, or your CRM changes something upstream. Improvado's best practices guide pushes in that direction for a reason.
Use these questions:
- How do you handle API changes? Ask what happens when ad or commerce platforms update schemas.
- How fresh is the data? Ask how often reports refresh and what causes delays.
- What breaks first at scale? Ask where limits appear as event volume or source count grows.
- How do you define the source of truth? Ask which system wins when revenue numbers conflict.
- What maintenance support exists? Ask whether connector upkeep is covered or patched ad hoc.
Pretty charts don't save broken pipelines
A dashboard can look polished and still be useless if it refreshes late or misstates revenue. That's why the buyer who asks about connector reliability usually ends up with a better stack than the buyer who asks about visual polish. In real operations, stale data is worse than ugly data.
How to benchmark performance is a good reminder that comparison only matters when the baseline is trustworthy. If you can't trust the input, the chart is just decoration.
The best test is blunt. If the vendor can't explain how data moves, who maintains it, and what happens when upstream definitions change, keep looking.
Practical Use Cases That Turn Analytics Into Revenue
Analytics only matters when it changes what the merchant does next. The strongest use cases are cart recovery and merchandising, because they connect shopper behavior to action without waiting for a monthly report.
Cart recovery starts with event-level visibility
If your funnel data shows a lot of add_to_cart and begin_checkout events but weak purchase completion, the issue probably isn't top-of-funnel traffic quality. It's more likely payment friction, shipping surprise, trust concerns, or a checkout step that's leaking shoppers. GA4's event model is built for that diagnosis because it keeps the journey at the event level instead of collapsing everything into a session summary. ReportDash's ecommerce analytics tools article is clear about how event-based schemas help merchants see the drop-off point.
That's where a recovery workflow becomes useful. If a shopper abandons a checkout or stalls at a specific step, a behavior-aware support or recovery layer can follow up with the right nudge instead of blasting the same generic reminder to everyone. That's a better use of analytics than staring at a weekly abandonment chart.
Merchandising gets sharper when customer questions become data
The second use case is merchandising content. When your support or onsite assistant sees repeated questions about sizing, ingredients, shipping, compatibility, or bundles, that's not just support noise. It's merchandising intelligence.
Carti's Insights Dashboard surfaces those recurring questions so merchants can decide what FAQ content to write, which product descriptions need expansion, and which bundles deserve promotion. That turns analytics into a feedback loop between behavior and merchandising instead of leaving it trapped in a report. For Shopify operators, that's valuable because it links shopper intent to content decisions, which often move conversion more than another ad tweak.
Practical rule: the best analytics signal is the one that changes a product page, a recovery message, or a bundle decision by tomorrow.
The smartest setup is a layered one. GA4 and Shopify Analytics tell you what happened, while behavior-driven tools tell you what shoppers asked for and where they hesitated. If those signals never reach merchandising, you're leaving revenue in the reporting stack.
A Practical Decision Framework and FAQ for 2026
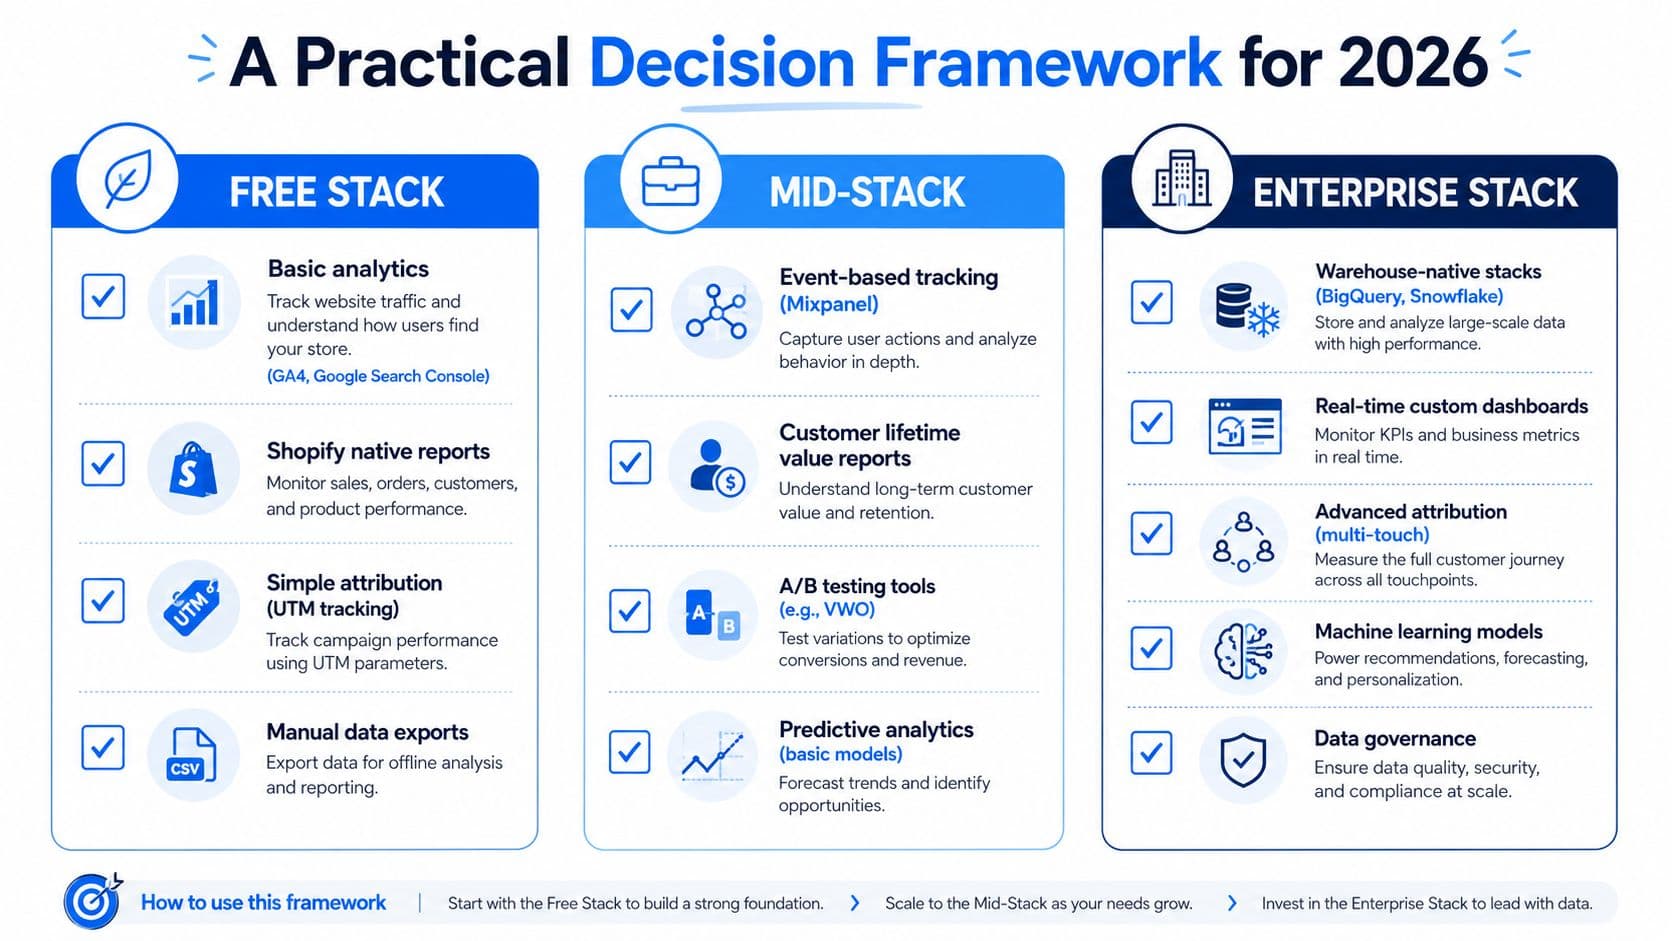
The right stack is staged, not aspirational. Most stores should start with a free baseline, add a behavioral layer when the questions get sharper, and move to a warehouse only when manual reconciliation starts wasting time. That sequence matches the operating complexity of the store, which is the only buying criterion that really matters.
Free stack
Use GA4 plus Shopify Analytics when you need a baseline view of traffic, sales, conversion, and product performance. Add simple UTM discipline and manual exports if needed. This works when you're still early and your reporting questions are straightforward.
Mid-stack
Add a behavioral tool like Mixpanel, Woopra, or a Shopify behavior layer when funnels, cohorts, or shopper intent start getting messy. This is also the stage where data integration starts to matter more, because ad, email, and commerce data need to speak the same language. A warehouse or unified pipeline starts making sense here.
Enterprise stack
Move into BigQuery, Snowflake, Redshift, or a managed analytics platform when you need governed reporting, cross-channel attribution, and profitability modeling across multiple systems. This is the point where source-of-truth consistency matters more than dashboard convenience.
A clean way to judge upgrade timing is this:
- Upgrade from free to mid-stack when you can't explain funnel drop-off with current reports.
- Upgrade from mid-stack to warehouse when manual reconciliation slows your team down.
- Upgrade to enterprise governance when conflicting numbers are hurting planning or spend decisions.
FAQ
When is GA4 plus Shopify Analytics enough?
It's enough when your store is still simple, your funnel is readable, and the team can answer core questions without arguing over data definitions.
What should trigger an upgrade?
If you're manually reconciling reports, can't trust source-level numbers, or need cohort and attribution views that current tools can't produce, it's time to move up.
How should connector reliability be evaluated?
Ask about refresh frequency, API change handling, maintenance support, and what happens when definitions shift upstream. Those questions matter more than chart design.
If you want a behavior layer that helps shoppers buy and helps your team act on onsite signals, Carti is built for exactly that use case. Visit Carti to see how it can turn customer questions, cart recovery, and merchandising signals into a tighter Shopify operating loop.

Written by
Daniel AndersonFounder of Carti. 10+ years building ecommerce brands in apparel and supplements. Still runs a Shopify store and built Carti to help merchants convert more browsers into buyers.
Ready to boost your store's sales?
Install Carti in 5 minutes and let AI handle customer questions, recommend products, and close sales 24/7.
Start Free Trial14-day free trial