
Most Shopify merchants start with the wrong question. They ask what a “good” conversion rate is, then go hunting for an industry average that was measured on a different catalog, a different traffic mix, and a different season. That's not how to benchmark performance in a way you can trust.
A better benchmark starts inside your store. Define the scope, choose the metric, document the conditions, then compare current results against your own baseline before you look outward. That lines up with established benchmarking guidance, which treats benchmarking as a repeatable cycle, not a one-time lookup, and warns that generic outside numbers can mislead if the datasets aren't comparable (performance benchmarking guidance). For Shopify, that shift matters because revenue lives in a few specific moments, conversion rate is only one of them, and surface-level averages can hide the core problem.
Why Most Benchmarking Advice Fails Shopify Stores
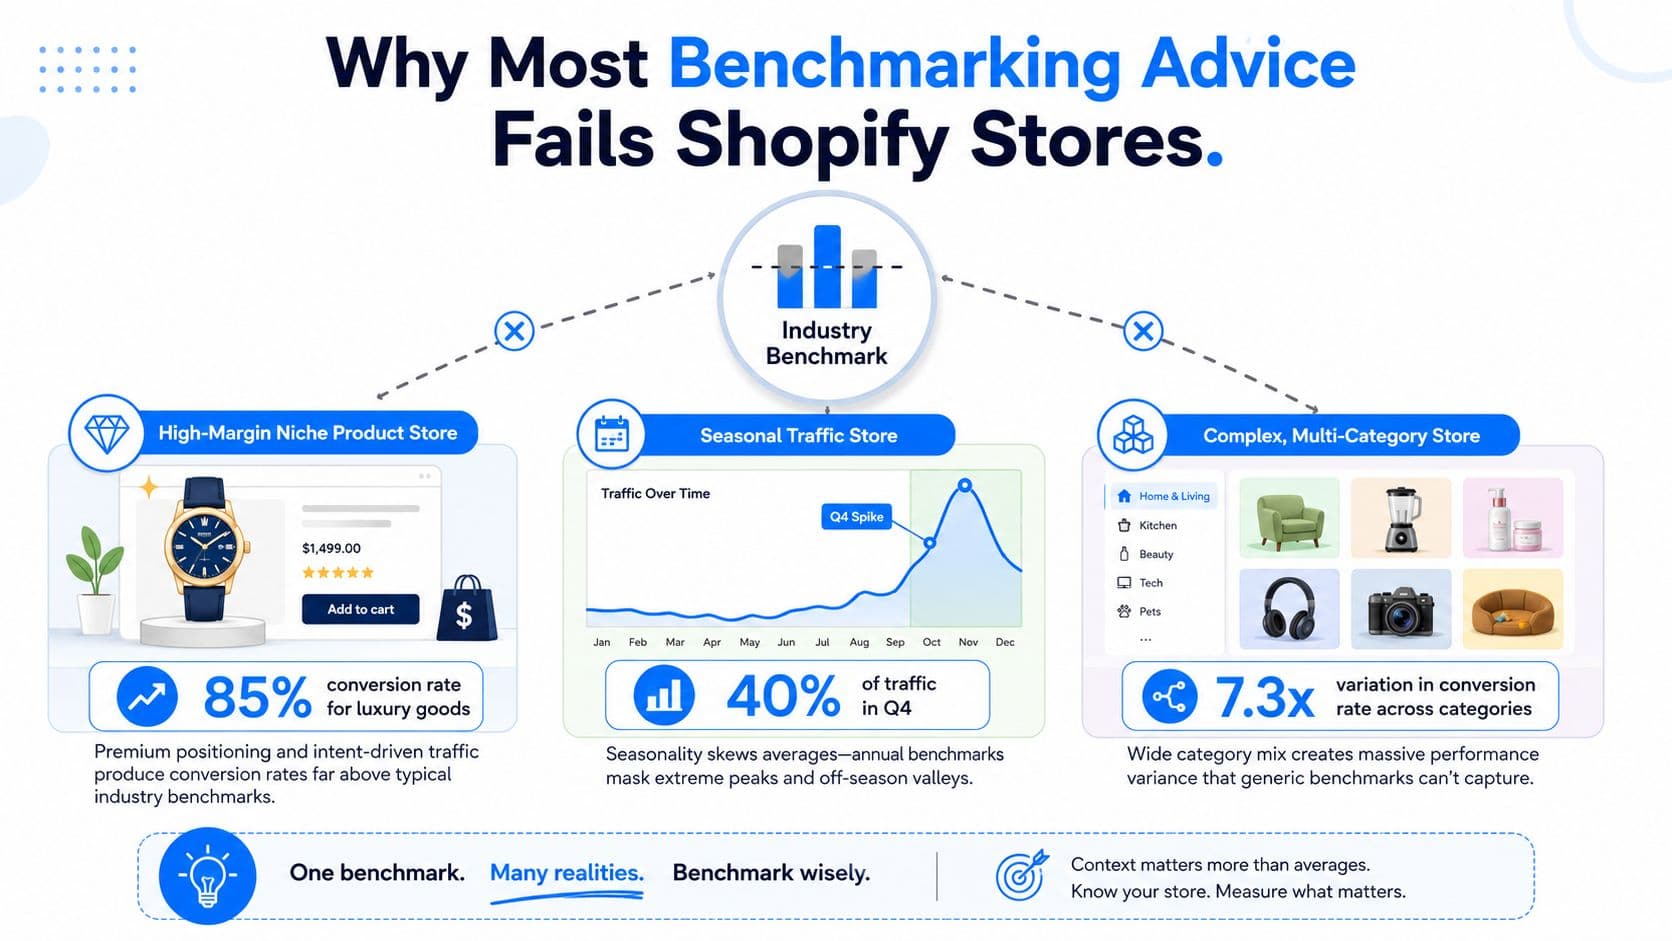
The advice to “just compare yourself to the industry average” sounds tidy, but it breaks down fast in ecommerce. A store selling high-margin niche products, a store with seasonal spikes, and a store with a broad multi-category catalog are not playing the same game, so a single conversion-rate number is usually noise, not a benchmark.
The cleanest starting point is always your own historical data. Benchmarking guidance recommends defining scope and objectives first, then selecting metrics, collecting relevant data, and comparing current performance to a target or best practice, and it specifically warns against using generic conversion-rate benchmarks from outside providers as if they were universal truth (performance benchmarking guidance). Avinash Kaushik makes the same practical point in digital analytics, urging teams to build benchmarks from observed month-over-month data across multiple years and multiple competitors, not from a single snapshot or self-reported survey numbers (Avinash Kaushik on benchmarking digital analytics performance metrics).
The three benchmark types that actually matter
For a Shopify merchant, benchmarking usually falls into three buckets. Internal benchmarks are the most defensible because they come from your own store, your own traffic, and your own measurement setup. Competitor benchmarks are useful when you can observe similar stores under similar conditions. Industry benchmarks are the loosest reference point, useful for sanity checks but weak as a target.
Practical rule: If you can't explain why two numbers were measured the same way, don't compare them.
That's the mindset shift that changes every later decision. Instead of asking whether your checkout conversion is “good,” you start asking whether it's better or worse than your documented baseline, on the same device mix, during the same part of the season, with the same definitions. That's a far better way to benchmark performance because it points directly to action, not vanity.
A well-run benchmark for Shopify usually centers on metrics tied to revenue and friction, such as store-wide conversion rate, add-to-cart rate, checkout abandonment, average order value, revenue per visitor, chat response time, and assisted conversion from on-site help. If the metric can't influence a decision, it doesn't deserve a place in the benchmark system.
Define Goals and Pick the KPIs That Actually Move Revenue
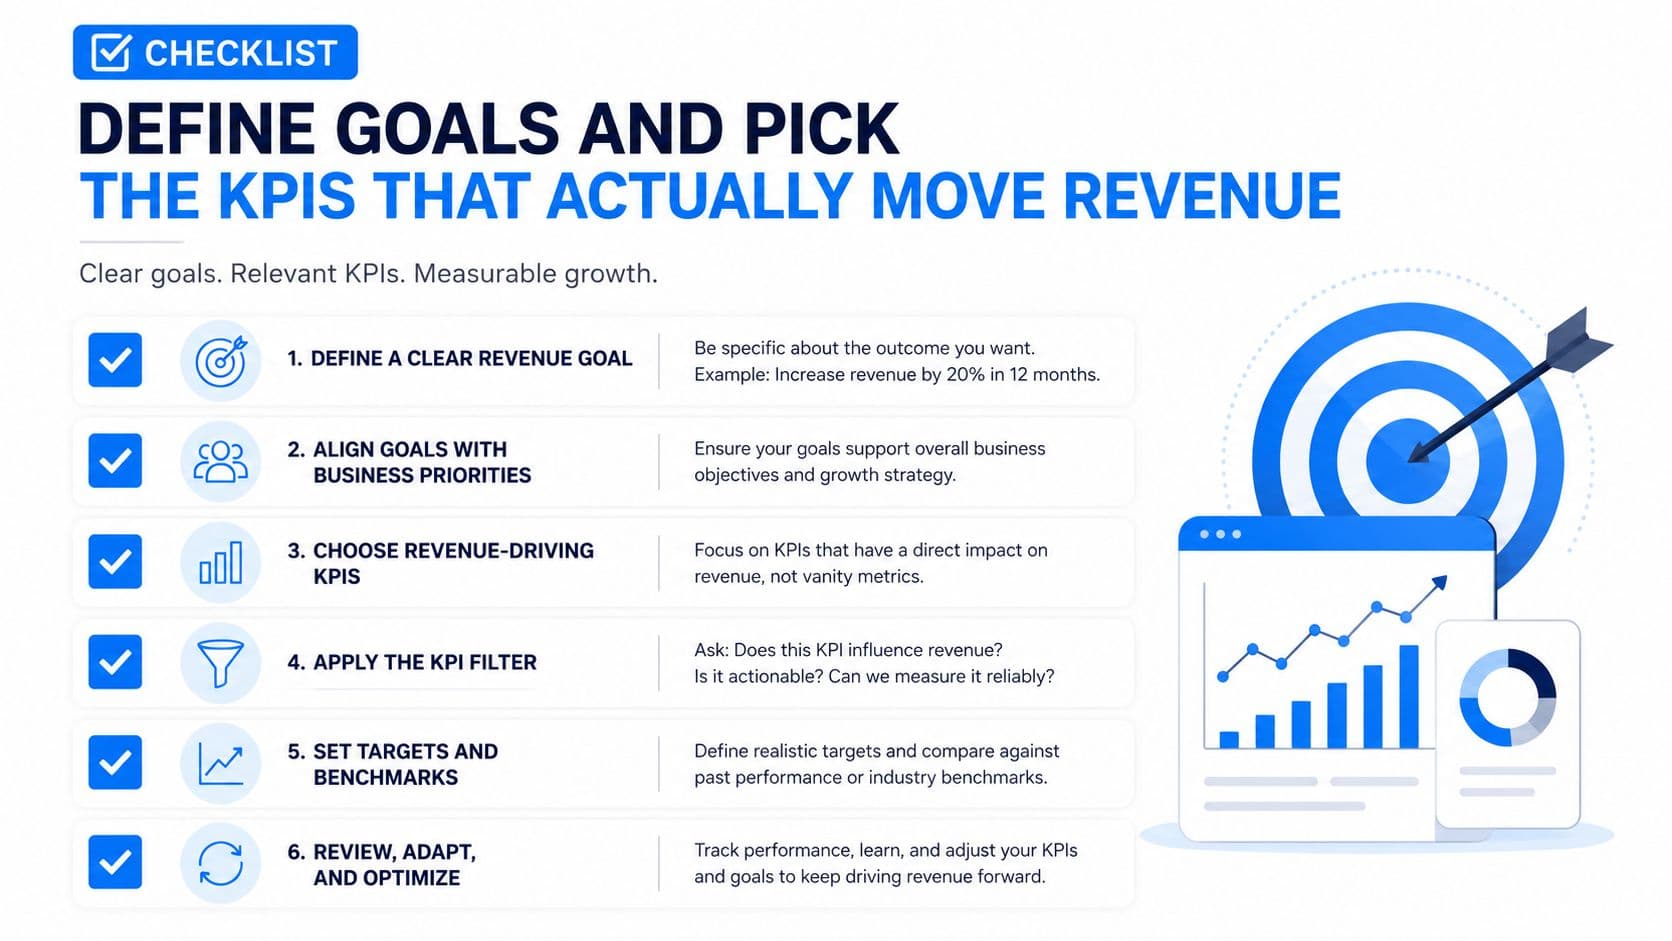
The easiest way to get benchmarking wrong is to start with metrics before you've named the business problem. A better sequence is simple. Start with the question you need answered, then choose the few KPIs that would prove whether the answer changed.
If the issue is checkout abandonment, track checkout abandonment, first-response time for support or chat if it affects purchase confidence, and revenue per visitor if you want the broader commercial result. If the issue is product page friction, add add-to-cart rate and maybe AI-assisted discovery metrics if shoppers are using chat to find products. For stores that care about basket quality, average order value matters more than raw visits because it tells you what each purchase is worth, not just how many people clicked.
The filter I trust is blunt. Does the metric move revenue, is it measurable today, and does someone own it? If the answer isn't yes on all three, the metric is probably dashboard decoration. That's especially true for Shopify teams that end up tracking too many numbers and then can't tell which one changed because of merchandising, paid traffic, or support changes.
Check your KPI fit before you measure
A small KPI set is usually stronger than a sprawling one. That's because each extra metric creates more debate about causality and more room for conflicting interpretations. A focused benchmark system gives you one owner, one definition, and one action path.
The category of metric should also match the workload. A support-heavy storefront may care more about chat response time and assisted conversion than a low-touch brand. A large catalog with many subcategories may need separate benchmarks by collection or traffic source, because the store-wide average hides what's happening in the highest-intent segments.
For a practical Shopify KPI framework, I'd start with the merchant-side breakdown in e-commerce key performance indicators. It's useful because it keeps the conversation on revenue mechanics, not vanity traffic graphs.
A good benchmark system doesn't ask every KPI to do the same job. It picks a few that answer specific business questions, then leaves the rest out. That's what keeps the measurement honest and the follow-up work manageable.
Build a Baseline You Can Actually Trust
A benchmark is useless if nobody can reproduce it. Nielsen Norman Group's baseline guidance is direct on this point, “a baseline without documentation isn't a baseline”, and that's especially true in Shopify, where traffic mix, seasonality, and device behavior can change the meaning of a single headline metric (baseline documentation guidance).
The baseline needs enough context that a future teammate could recreate the measurement without guessing. That means the date range, the traffic source, the device split, the customer cohort, and the exact definition of the metric. If one month includes a paid social push and the next month doesn't, or if the baseline mixes new and returning customers without saying so, the comparison becomes fuzzy fast.
What to document in a baseline card
A simple baseline card works better than a sprawling spreadsheet. Keep it narrow and consistent.
- Scope: Name the page, funnel, campaign, or customer cohort.
- Definition: Write the exact metric definition, including what counts and what doesn't.
- Conditions: Log traffic source, device mix, and any campaign or promotion that could move the number.
- Timing: Record the date range and review cadence.
That last part matters more than people think. Benchmarking guidance treats the process as a cycle, with regular review intervals such as weekly, monthly, quarterly, or annually depending on the business process being measured (performance benchmarking guidance). In ecommerce, a checkout baseline measured during a holiday campaign is not the same thing as a baseline measured during a quiet week, even if the dashboard label is identical.
For a deeper walk-through of how teams keep baseline data clean in the age of AI summaries, Month17's piece on pre-AI Overviews baseline data is a useful companion. The core idea is the same one that holds in Shopify: consistency beats volume.
A baseline gets useful when it describes the conditions that produced it, not just the number itself.
Once you have that card, you've got something you can compare against again and again. That's the difference between a report and a benchmark.
Choosing Between Internal, Competitor, and Industry Benchmarks
Internal, competitor, and industry benchmarks all have a place, but they don't deserve equal trust. Internal data is usually the strongest because it comes from your store under your own operating conditions. Competitor data can help if you can observe something genuinely comparable. Industry averages are broad, but broad often means diluted.
The right source depends on the decision you're trying to make. If you're diagnosing whether your checkout got worse after a theme change, internal history is the only benchmark that matters. If you're sanity-checking whether your support response time is wildly off versus similar stores, a few observed peers can help. If you're trying to understand the general shape of ecommerce performance, an industry number may be a rough map, but not a target.
For broader context on outside comparisons, CartBoss has a practical overview of performance benchmarking for e-commerce. The useful takeaway is that ecommerce benchmarks are only meaningful when the measurement method and operating conditions are comparable, which is exactly where most generic averages fall apart.
| Benchmark Type | Trust Level | Effort to Collect | Best Used For |
|---|---|---|---|
| Internal historical data | High | Low to moderate | Detecting real change, checking fixes, setting operational targets |
| Competitor performance | Medium | Moderate to high | Sanity-checking your position against similar stores |
| Industry averages | Low to medium | Low | Broad context, not decision-making |
The mistake I see most is using industry average as the goal and internal data as the afterthought. That usually produces a bad plan because the store starts chasing a number that was never measured under the same conditions.
Decision rule: Start with internal data, layer in one or two observed competitors if they're truly comparable, and treat the industry number as a floor or ceiling check, not the finish line.
For Shopify teams, the internal-first approach lines up with the merchant-specific benchmarks discussed in Shopify conversion rate benchmarks. The point isn't to ignore external data. The point is to stop letting weak external data outrank your own measurement system.
Run the Measurements With the Right Tools and Statistical Rigor
Benchmarking falls apart fastest when teams measure the wrong thing, on the wrong traffic, with tools that do not agree with each other. A Shopify store can look “better” in one dashboard and worse in another because each system is capturing a different slice of the customer journey.
Start with the measurement environment you operate in. Benchmark testing guidance recommends building workloads from production access logs instead of assuming artificial spikes, because real user patterns expose the issues that synthetic tests miss (benchmark testing guidance). For shopper-facing work, the numbers that deserve attention are response-time percentiles like p95 and p99, plus error rate, since averages can hide the slowdowns that hurt conversion.
What the tool stack should capture
Match the tool to the metric, then keep the definitions consistent. Shopify Analytics belongs on sales and checkout behavior. GA4 is better for session and source analysis. Hotjar or another session tool helps explain where friction shows up. An AI chat dashboard should record response time, deflection, assisted conversion, and the content patterns that lead to purchase. If your team wants a more structured view of customer behavior, customer analytics for Shopify stores gives the cleanest path from raw events to decisions.
Run repeated tests, not a single lucky pass. Guidance on benchmark testing recommends at least 5 identical benchmark iterations, and 10+ for higher-stakes release or procurement decisions. If the coefficient of variation exceeds 5%, treat the environment as unstable before you trust the result (benchmark testing guidance). Shopify teams do not need lab-style formality for every experiment, but one good traffic day is not proof.
Record the conditions with the result. Benchmark workflow guidance recommends a closed loop, measure current performance, explain anomalies, test the explanation, and then re-run after improvement, while also checking whether differences are statistically meaningful rather than incidental (benchmark workflow and comparability guidance). That applies to checkout changes, product page changes, and AI chat flows. If the traffic mix, device mix, or offer changed, the benchmark changed too.
For merchants who need external context without letting it replace their own baseline, the guide to find ecommerce conversion benchmarks is a practical reference. Use it as a check against your internal numbers, not as the number you chase.
Analyze Gaps and Turn Them Into an Action Plan
A gap by itself is just a complaint with a chart attached. The useful move is to turn the gap into a sequence of tests, each one tied to a plausible cause.
Say a fashion store sees mobile checkout abandonment sit above its internal baseline. The first questions are boring, and that's a good sign. Did the traffic mix change? Are more visitors coming from paid social on slower devices? Did payment options shift? Is shipping cost appearing later than expected? The point is to isolate the variable before changing the experience.
Test one hypothesis at a time
When you do find a likely cause, test it in isolation. If shipping cost visibility is the issue, don't also change copy, layout, and payment methods in the same release. That makes the result hard to interpret. In benchmark terms, the action plan should be able to answer one question at a time: did the change move the metric enough to matter?
This is also where AI chat can help as both a measurement source and a lever. Chat-assisted conversion, response time, and deflection rate tell you where shoppers are asking for help, and the answers themselves can reduce friction. Smart suggestions can surface relevant products when shoppers are stuck, while cart recovery nudges give you another path to compare against the abandonment baseline. The right comparison is simple, did the intervention improve the benchmarked metric in the same measurement window and under similar conditions?
If you can't describe the expected effect before the test, you probably don't know what the test is for.
A practical release rule keeps teams honest. In lightweight CI-style benchmarks, treat any regression greater than 10% from baseline as a signal to investigate, while full staging benchmarks should be gated against predefined acceptance thresholds (benchmark workflow and comparability guidance). That rule is less about fear and more about discipline. It stops teams from shipping a silent downgrade because the dashboard was noisy.
The best action plan is small, causal, and reversible. Benchmark first, explain the gap, test one fix, then compare against the same baseline again. That loop is what turns benchmarking into growth work instead of reporting work.
Monitor, Iterate, and Use Carti to Keep Your Numbers Honest
Benchmarking only works if it becomes part of the operating cadence. Weekly review makes sense for ad-driven traffic. Monthly review fits checkout and conversion work. Quarterly review is a better fit for measuring the effect of AI assistant changes, because those systems often influence more than one step in the purchase path.
The recurring mistake is comparing one number to another without checking the definition or the window. A metric measured on a promo-heavy week is not the same as the same metric measured on a normal week. Keep a log of each run, attach the conditions, and carry the baseline forward only when the measurement method stays consistent.
That's where a structured measurement surface helps. Carti's Insights Dashboard surfaces shopper questions that can shape merchandising and content. Its Cart Recovery and Smart Suggestions features also create benchmarkable conversion and revenue signals, so you can compare the effect of each change against your documented baseline instead of relying on gut feel. In practice, that means the same benchmarking habits apply whether you're judging support quality, recommendation quality, or checkout rescue performance.
Final check: If the data changed, ask whether the definition changed first.
A clean recurring checklist is simple. Review the KPI on schedule, confirm the baseline conditions, compare the current run against the same cohort, and decide whether the change is large enough to act on. That habit is what keeps benchmarking useful after the novelty wears off.
If you want a benchmarking system that helps you make better Shopify decisions instead of chasing noisy averages, try Carti as part of that measurement loop. It gives you an always-on surface for shopper questions, recommendations, and recovery, so you can see what's moving the numbers in your store. Visit Carti to set it up and use it as one of the inputs in a benchmark system you can trust.

Written by
Daniel AndersonFounder of Carti. 10+ years building ecommerce brands in apparel and supplements. Still runs a Shopify store and built Carti to help merchants convert more browsers into buyers.
Ready to boost your store's sales?
Install Carti in 5 minutes and let AI handle customer questions, recommend products, and close sales 24/7.
Start Free Trial14-day free trial