
Most Shopify stores convert only a small share of their traffic. The widely cited platform benchmark sits at about 1.4% according to Shopify conversion rate benchmark data summarized by Uptek. That sounds like a score. It's more useful as a diagnostic.
A benchmark doesn't tell you whether your store is good or bad in isolation. It tells you where to start looking. If your store is below the range you'd expect for your category or device mix, you don't need motivation. You need triage. If you're above average, that doesn't mean you're done. It means you should protect what's working and tighten the weak points that still leak sales.
That's how I use Shopify conversion rate benchmarks with merchants. Not as bragging rights, and not as a vanity metric. As a way to ask sharper questions about traffic quality, product pages, checkout friction, mobile usability, and buyer intent.
Why Conversion Rate Is Your Most Important Metric
Traffic gets attention because it's easy to see. Conversion rate deserves more attention because it tells you whether your store sells.
A store can buy more clicks, grow sessions, and still struggle if visitors don't trust the offer, can't find answers, or hit friction at checkout. Conversion rate cuts through that noise. It measures how well your store turns existing demand into revenue.
That's why I treat conversion rate as a health metric. It reflects product page clarity, traffic quality, merchandising, trust, pricing presentation, shipping communication, and checkout usability all at once. When it moves, something underneath it usually changed too.
Practical rule: Don't ask, “How do I get more traffic?” until you can answer, “What happens to the traffic I already have?”
A traffic-first mindset often hides inefficient growth. If your store converts poorly, paying for more visitors can magnify waste. A conversion-first mindset is usually more durable because it improves the economics of every channel you already run, whether that's Meta ads, Google Shopping, email, influencer traffic, or organic search.
Merchants who monitor the right supporting metrics tend to make better calls faster. If you want a simple framework for that, this guide to e-commerce KPIs that actually matter is a useful companion to benchmark work.
Why merchants overvalue traffic
Traffic feels like momentum. Conversion rate feels like scrutiny.
That's why teams often celebrate campaign reach while ignoring product pages that confuse buyers or checkout flows that create hesitation. In practice, a lower-traffic store with stronger conversion usually has a healthier foundation than a high-traffic store that can't turn visits into orders consistently.
What conversion rate reveals
When conversion rate drops, I don't assume the whole store is failing. I assume one of a few things is off:
- Traffic quality changed: You attracted colder visitors than usual.
- Offer clarity weakened: Product pages stopped answering key buyer questions.
- Friction increased: Mobile navigation, cart, or checkout got harder to use.
- Trust signals fell short: Reviews, policies, delivery expectations, or returns information weren't visible enough.
Benchmarks matter because they help you decide whether you're looking at a normal range or a problem worth urgent attention.
What Is a Good Shopify Conversion Rate
A good Shopify conversion rate is one that makes sense for what you sell, who you attract, and how people buy in your category. “Good” is never a universal number.
The simple formula is:
(Purchases / Sessions) x 100 = Conversion Rate
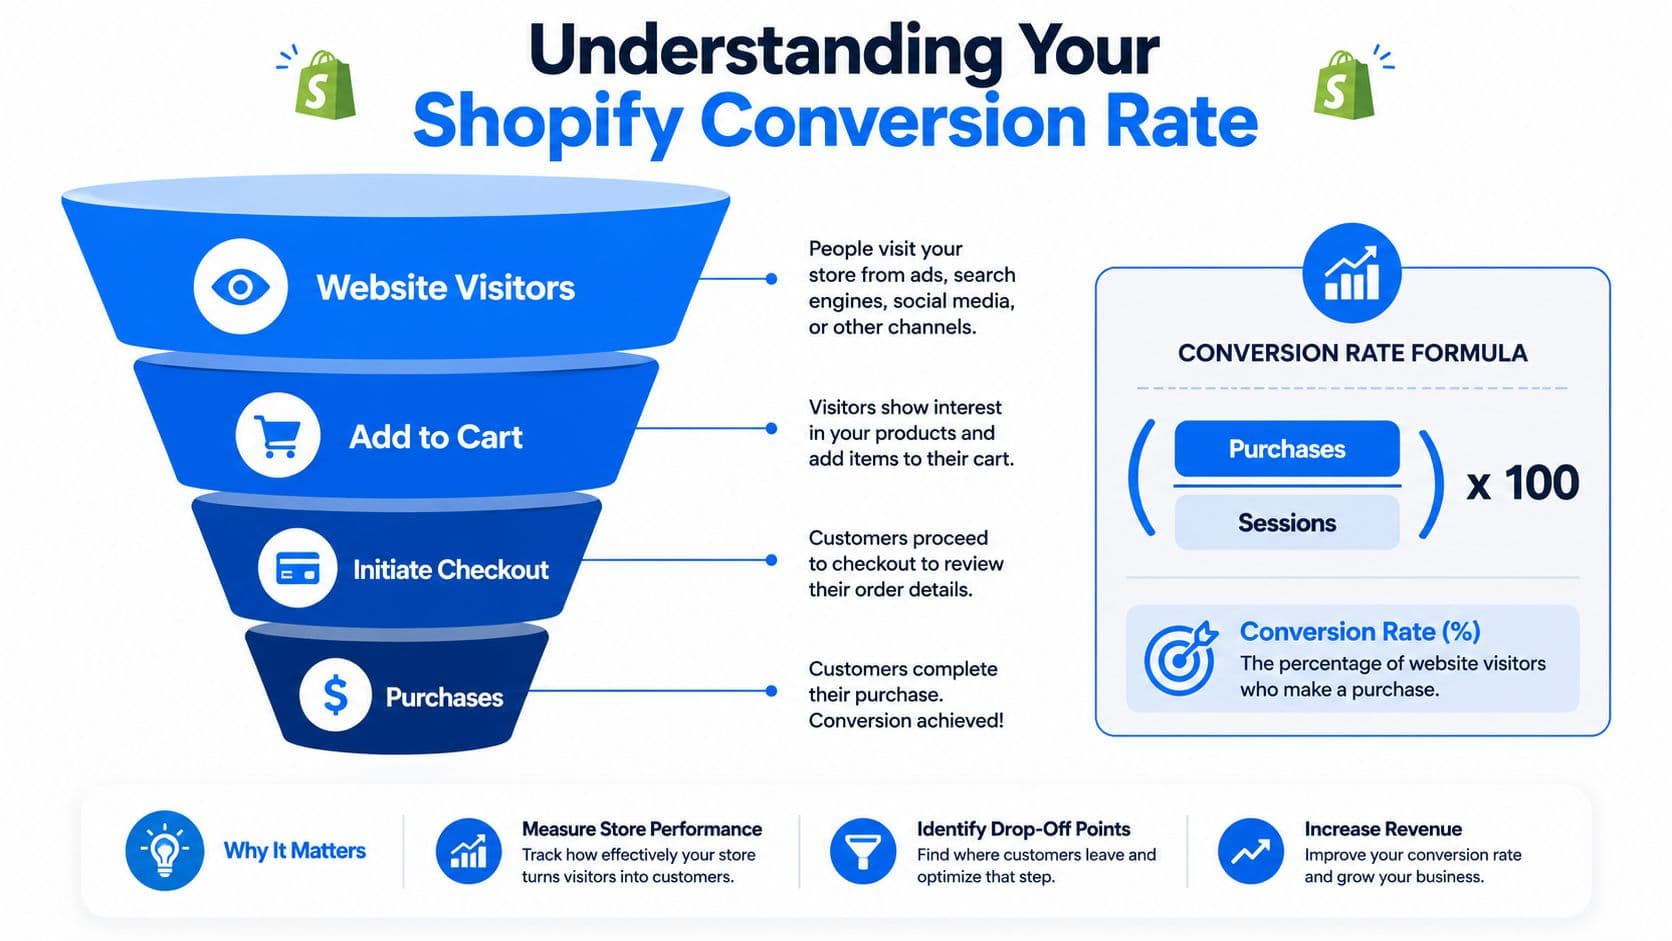
Think of your store like a physical retail shop. Plenty of people walk in. Fewer pick something up. Fewer still carry it to the register. The final group pays. Your online conversion rate is the end result of that entire journey, not just the checkout step.
How to calculate it correctly
Use the same denominator your platform uses for consistency. On Shopify, merchants typically work from sessions and purchases, not a looser estimate of interest or intent.
If you had 1,000 sessions and 14 purchases, your conversion rate would be 1.4%. That doesn't tell you whether performance is healthy yet. It tells you where to compare.
What matters next is whether those sessions came from high-intent branded search, repeat customers, cold social traffic, or a mix that naturally converts differently.
Why one number never tells the full story
A blended storewide conversion rate can hide the underlying issue. That's why I rarely look at it alone for long.
You need to break the journey into stages:
- Visitors: People who landed on the site
- Add to Cart: Shoppers who showed product-level intent
- Initiate Checkout: Buyers who moved past browsing
- Purchase: Customers who completed the order
If a lot of people visit but few add to cart, the problem usually lives on landing pages or product pages. If many reach checkout but don't purchase, the issue is more often friction, trust, surprise costs, or payment hesitation.
A benchmark is useful only when it leads to a question like, “Where are people dropping off?” rather than, “How do I make this number look higher?”
Good performance also depends on category context. A low-friction, replenishable product behaves differently from a considered purchase. A snack brand, skincare subscription, or household consumable often earns faster decisions than premium furniture, custom jewelry, or a high-ticket decor item.
That's why merchants get into trouble when they compare themselves to broad averages without context. The benchmark should guide diagnosis, not trigger panic.
Key Shopify Conversion Rate Benchmarks for 2026
A store converting at 1.4% can be perfectly healthy in one category and underperforming badly in another. That is why benchmark data is useful only if you read it in context.
As noted earlier, widely cited Shopify benchmark data puts the global average around 1.4%. The same benchmark set shows Food & Beverage at roughly 2.8% to 6.11%, Luxury & Jewelry below 1.19%, mobile around 1.2%, and desktop around 1.9%. It also places stores under 1% in the range where conversion work is usually needed, while 2%+ is commonly treated as strong performance.
Benchmark table
| Category | Average Conversion Rate |
|---|---|
| Shopify worldwide average | 1.4% |
| Food & Beverage | 2.8% to 6.11% |
| Luxury & Jewelry | Below 1.19% |
| Mobile | 1.2% |
| Desktop | 1.9% |
These numbers are a starting point for diagnosis.
A broad average hides the factors that shape conversion. Category matters. Device matters. Traffic source matters. A repeat customer from email behaves differently than a first-time visitor from paid social, which is why it helps to review your website traffic sources and intent mix before treating any benchmark as a verdict.
The category spread is easy to explain in practice. Food and beverage often converts faster because shoppers understand the product quickly, the price is usually easier to accept, and replenishment behavior shortens the decision cycle. Luxury and jewelry usually require more comparison, more trust, and more product detail. Lower conversion in those categories does not automatically point to weak execution.
The device gap is just as useful. Desktop usually converts better, but mobile often carries more first-touch traffic and more casual browsing. In audits, I regularly find stores where desktop looks polished while mobile has crowded galleries, hard-to-use variant selectors, sticky bars that cover content, or checkout friction that cuts purchase intent before the sale is finished.
Use the benchmark to narrow the problem:
- Below the global average: review traffic quality, product page performance, and checkout friction first.
- Near average: compare your number against your category, average order value, and customer intent mix.
- Large mobile-desktop gap: inspect mobile UX before changing offers or ad spend.
- Healthy desktop conversion but weak storewide conversion: check whether mobile traffic or colder acquisition channels are dragging down the blended result.
Stores that want to improve Shopify conversion rates usually get better results by working from these segments instead of chasing a single headline number. Benchmarks are most useful when they help you ask sharper questions, find the biggest leak, and prioritize fixes that can move revenue.
How to Diagnose Your Conversion Rate Problems
When a merchant says, “My conversion rate is low,” that's a symptom, not a diagnosis. The useful question is where the buying process breaks down.
I think about this like a health check. First, compare the vital signs against a realistic benchmark. Then inspect the systems one by one until the weak point becomes obvious.
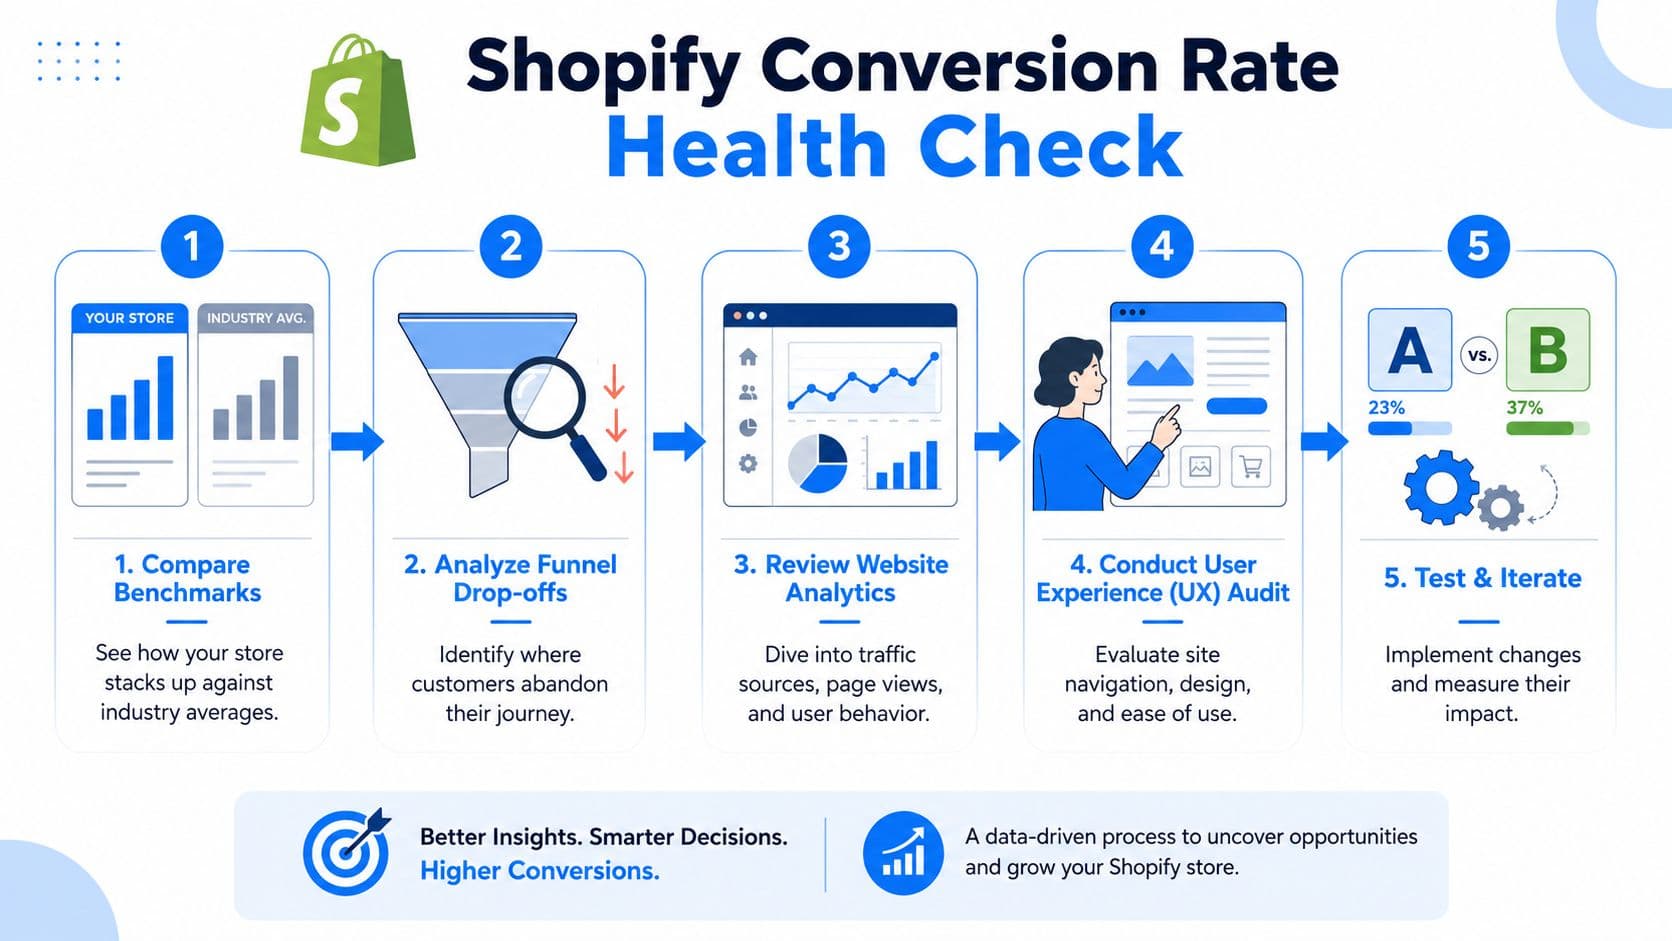
Start with the funnel, not the homepage
Diagnosis often begins by debating design. That's usually backwards.
Open Shopify Analytics and your GA4 reports, then inspect the funnel in order. Look at the journey from landing page to product page, from product page to cart, from cart to checkout, and from checkout to purchase. You're not hunting for a “bad site.” You're locating the sharpest drop-off.
A few common patterns show up quickly:
- Weak product page progression: Traffic arrives, but shoppers don't add to cart.
- Cart hesitation: Buyers add products, then stall before checkout.
- Checkout abandonment: Intent is strong, but final completion falls apart.
Each pattern points to different fixes. If add-to-cart is weak, rewriting checkout copy won't help. If checkout is where buyers leave, changing your homepage hero won't matter much.
For merchants looking for a practical framework to improve Shopify conversion rates, the strongest advice is usually the least glamorous. Find the exact step where buyers hesitate, then remove friction there first.
Segment before you change anything
Averages hide problems. Segments expose them.
Break your conversion data down by:
- Device type: Mobile and desktop behavior rarely match.
- Traffic source: Paid social, branded search, email, direct, and organic visitors arrive with very different intent.
- Landing page: Some pages attract curiosity. Others attract buyers.
- New vs returning visitors: Returning customers often need less persuasion.
The same store can look healthy in one segment and broken in another. I've seen merchants blame their site when the underlying problem was low-intent campaign traffic hitting weak landing pages. I've also seen teams blame paid traffic when the bigger issue was a mobile PDP that buried shipping and returns info too far down the page.
That's why traffic source segmentation matters. If you want a better handle on how those visitors differ before they ever hit checkout, this breakdown of website traffic sources and what they mean helps frame the analysis.
Don't redesign the whole store because one segment underperforms. Fix the segment, page type, or device experience causing the leak.
Once you know the weakest segment, review real sessions from that cohort. Watch how shoppers scroll, where they pause, which elements they ignore, and where they abandon. Analytics tell you what happened. Session observation usually tells you why.
Prioritized Tactics to Boost Your Conversion Rate
Once you know where conversion breaks, the order of operations matters. Many stores waste time on advanced CRO ideas while basic friction remains untouched.
I prioritize fixes by how close they are to the purchase decision. Product understanding, trust, and checkout ease come before creative experiments.
Fix the friction buyers feel first
Start with pages that directly influence purchase intent. In most stores, that means collection pages, product pages, cart, and checkout.
These fixes usually deserve attention before anything else:
- Tighten product page clarity: Buyers should understand what the product is, who it's for, what problem it solves, and what they'll receive without hunting for answers.
- Improve media quality: Good photography reduces uncertainty. For many categories, close-up visuals, scale references, texture shots, and short demo clips matter more than decorative branding.
- Make calls to action obvious: Add to Cart buttons shouldn't compete with clutter, hidden variant selectors, or distracting app widgets.
- Show key policy info early: Shipping timing, returns, and fit guidance often answer the objection that stops the purchase.
- Reduce mobile friction: Keep tap targets clean, forms short, and page layouts easy to scan on smaller screens.
A lot of practical CRO work is unglamorous. Clearer variant selection beats clever copy. Better size guidance beats another homepage banner. Faster answers beat prettier animations.
Use support signals to remove purchase doubt
A surprising number of conversions die because buyers can't get a simple question answered in the moment. They wonder about sizing, materials, compatibility, delivery windows, care instructions, returns, or whether a product fits their use case. If the answer isn't easy to find, many leave.
That's why onsite support and sales assistance can become a conversion lever, not just a service function. Helpful guidance at the right moment can reduce hesitation, surface the right product, and recover intent that would otherwise disappear.
This is one reason experienced operators pay attention to practical CRO resources like Yassine Malti's CRO advice. The strongest conversion improvements often come from reducing uncertainty, not from forcing urgency.
A strong support layer usually does four things well:
- Answers pre-purchase questions quickly
- Guides buyers to the right product
- Clarifies policy and delivery concerns
- Re-engages shoppers who stall before buying
For stores that want a broader playbook for this work, this guide on Shopify conversion rate optimization is worth keeping handy during implementation.
Here's a walkthrough that shows how merchants think about these conversion levers in practice:
Build a testing habit, not a redesign habit
Many merchants overestimate the value of sweeping redesigns and underestimate disciplined iteration.
A full redesign can improve performance, but it can also erase working elements along with weak ones. A stronger approach is to identify one bottleneck at a time and test improvements against it. That could be product page layout, CTA hierarchy, trust badge placement, review visibility, bundle framing, shipping language, or cart messaging.
The best CRO programs don't chase novelty. They keep asking, “What stopped this shopper from buying, and how do we remove that obstacle?”
A practical prioritization sequence looks like this:
| Priority | Focus area | What to check |
|---|---|---|
| First | Product understanding | Clarity, imagery, variants, FAQs |
| Second | Trust | Reviews, policies, delivery expectations |
| Third | Checkout ease | Payment flow, form friction, mobile usability |
| Fourth | Recovery | Cart reminders, follow-up prompts, support access |
| Fifth | Experimentation | A/B tests on proven bottlenecks |
If you do this well, benchmarks stop feeling abstract. They become a filter for deciding what deserves attention now and what can wait.
Your Shopify Conversion Benchmarking Checklist
Benchmarks only help if they change weekly behavior. Most merchants don't need a more complicated dashboard. They need a repeatable operating checklist.
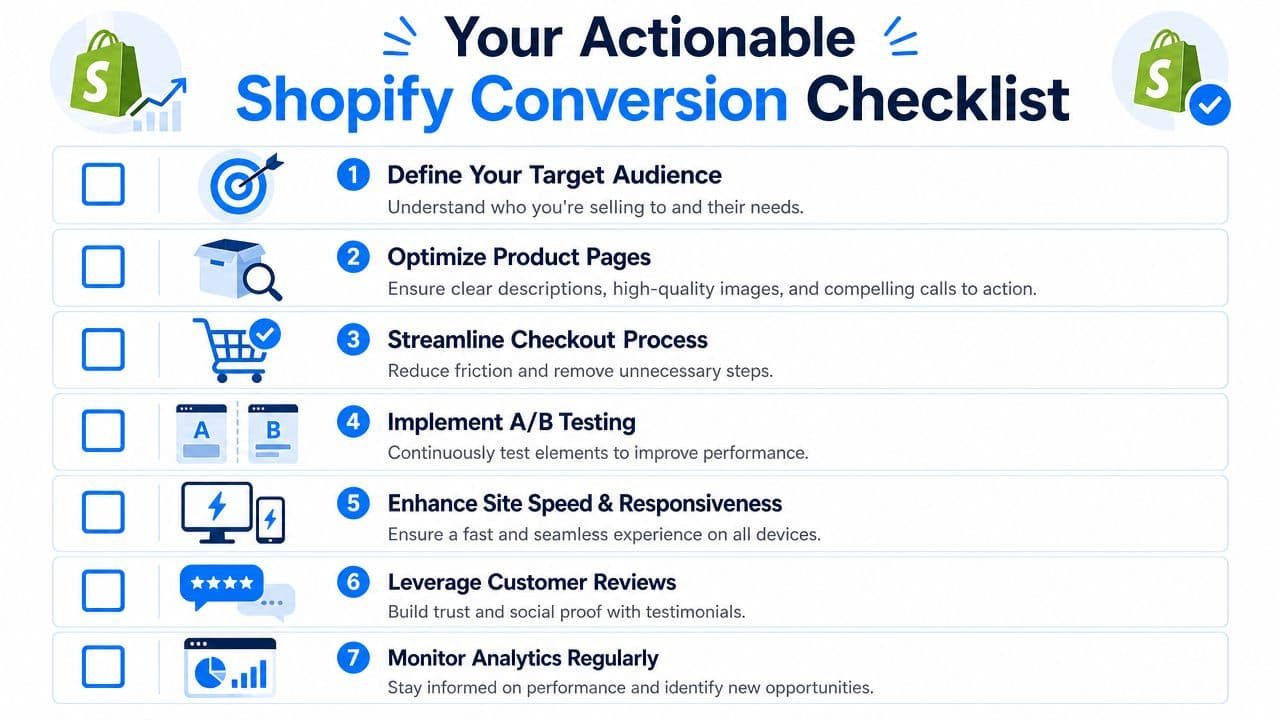
Weekly operating checklist
Use this list to turn Shopify conversion rate benchmarks into action:
- Calculate your current rate: Use purchases divided by sessions so you're comparing like with like.
- Choose the right benchmark: Compare against category and device context, not just the platform average.
- Check whether you're below a healthy floor: If you're under the normal range for your context, assume there's a leak worth finding.
- Review the funnel by step: Look at visitor to product engagement, add to cart, checkout initiation, and completed purchase.
- Segment your data: Separate mobile from desktop, and separate traffic sources before drawing conclusions.
- Inspect the highest-friction pages: Product pages, cart, and checkout usually deserve review before homepage tweaks.
- Implement one focused fix at a time: Don't change ten things at once if you want to know what helped.
What a useful benchmark habit looks like
The right mindset is simple. Use benchmarks to ask better questions, not to chase a vanity milestone.
If your store sits below expectation, don't jump straight into a redesign. Verify where the drop starts. If your store is healthy overall but one segment lags, fix the segment. If your desktop performance is solid and mobile is weak, work mobile. If product pages convert intent poorly, solve clarity and trust before worrying about ad creative.
That's the core value of Shopify conversion rate benchmarks. They turn a vague concern into a practical workflow.
A good benchmark process is calm, specific, and repetitive. You review, isolate, fix, observe, and repeat. Stores improve faster when the team treats conversion like an operating discipline instead of a periodic panic.
If you want a practical way to turn more browsers into buyers without forcing shoppers to wait for answers, Carti is worth a look. It gives Shopify stores an AI sales and support assistant that can answer product questions, guide shoppers to the right items, and help recover purchase intent around the clock.

Written by
Daniel AndersonFounder of Carti. 10+ years building ecommerce brands in apparel and supplements. Still runs a Shopify store and built Carti to help merchants convert more browsers into buyers.
Ready to boost your store's sales?
Install Carti in 5 minutes and let AI handle customer questions, recommend products, and close sales 24/7.
Start Free Trial14-day free trial