You open Shopify analytics, see revenue holding steady, and assume the store is fine. Then you look closer. A large share of sales came from first-time buyers, paid acquisition costs are rising, and very few customers are coming back on their own.
That’s the moment when returning customer rate stops being a vanity metric and starts acting like a health check. It tells you whether your store is building demand that compounds, or renting demand one order at a time.
A lot of merchants react to a low number by throwing tactics at the problem. They add a loyalty app, send a discount email, install a popup, and hope something sticks. That usually wastes time because low RCR is a symptom, not a diagnosis. The right fix depends on why customers aren’t returning.
Table of Contents
- Why Returning Customers Are Your Store's Hidden Engine
- How to Calculate Your Returning Customer Rate
- What Is a Good Returning Customer Rate
- Diagnosing the Cause of a Low RCR
- 7 Proven Tactics to Increase Returning Customers
- How to Measure and Test Your Retention Strategy
- From Metric to Mission Your Path to Profitable Growth
- Frequently Asked Questions About RCR
Why Returning Customers Are Your Store's Hidden Engine
Most Shopify owners spend more time reviewing top-line sales than asking where those sales came from. That’s a mistake. Revenue from first-time buyers behaves very differently from revenue from people who already know your brand, trust your shipping, and don’t need much persuasion to buy again.
The economics are blunt. Returning customers spend 67% more per transaction than new customers, and a 5% improvement in customer retention can increase profitability by 25% to 95%, according to CRO Benchmark’s retention research. That’s why retention work often creates cleaner profit than another round of acquisition spending.
There’s another reason this matters. Repeat purchase behavior makes the business less fragile. When promotions get expensive, ad performance gets choppy, or seasonality hits harder than expected, stores with a healthy returning customer rate have a cushion. Stores without it have to buy nearly every order again.
Practical rule: If your store only grows when ad spend rises, you don’t have reliable retention yet.
For many smaller brands, repeat buyers aren’t a side channel. They’re the business core. If you want stronger customer relationships, better support practices matter just as much as offers and emails. Operational details, like how your team handles questions and complaints, shape whether someone buys again. A strong guide to customer service etiquette for ecommerce teams is often more useful than another discount campaign.
Returning customer rate matters because it compresses several truths into one number. It reflects product-market fit, post-purchase experience, customer support quality, merchandising relevance, and brand trust. That’s why I treat it as a diagnostic metric first and a marketing KPI second.
How to Calculate Your Returning Customer Rate
Returning customer rate is simple on paper and easy to misread in practice.
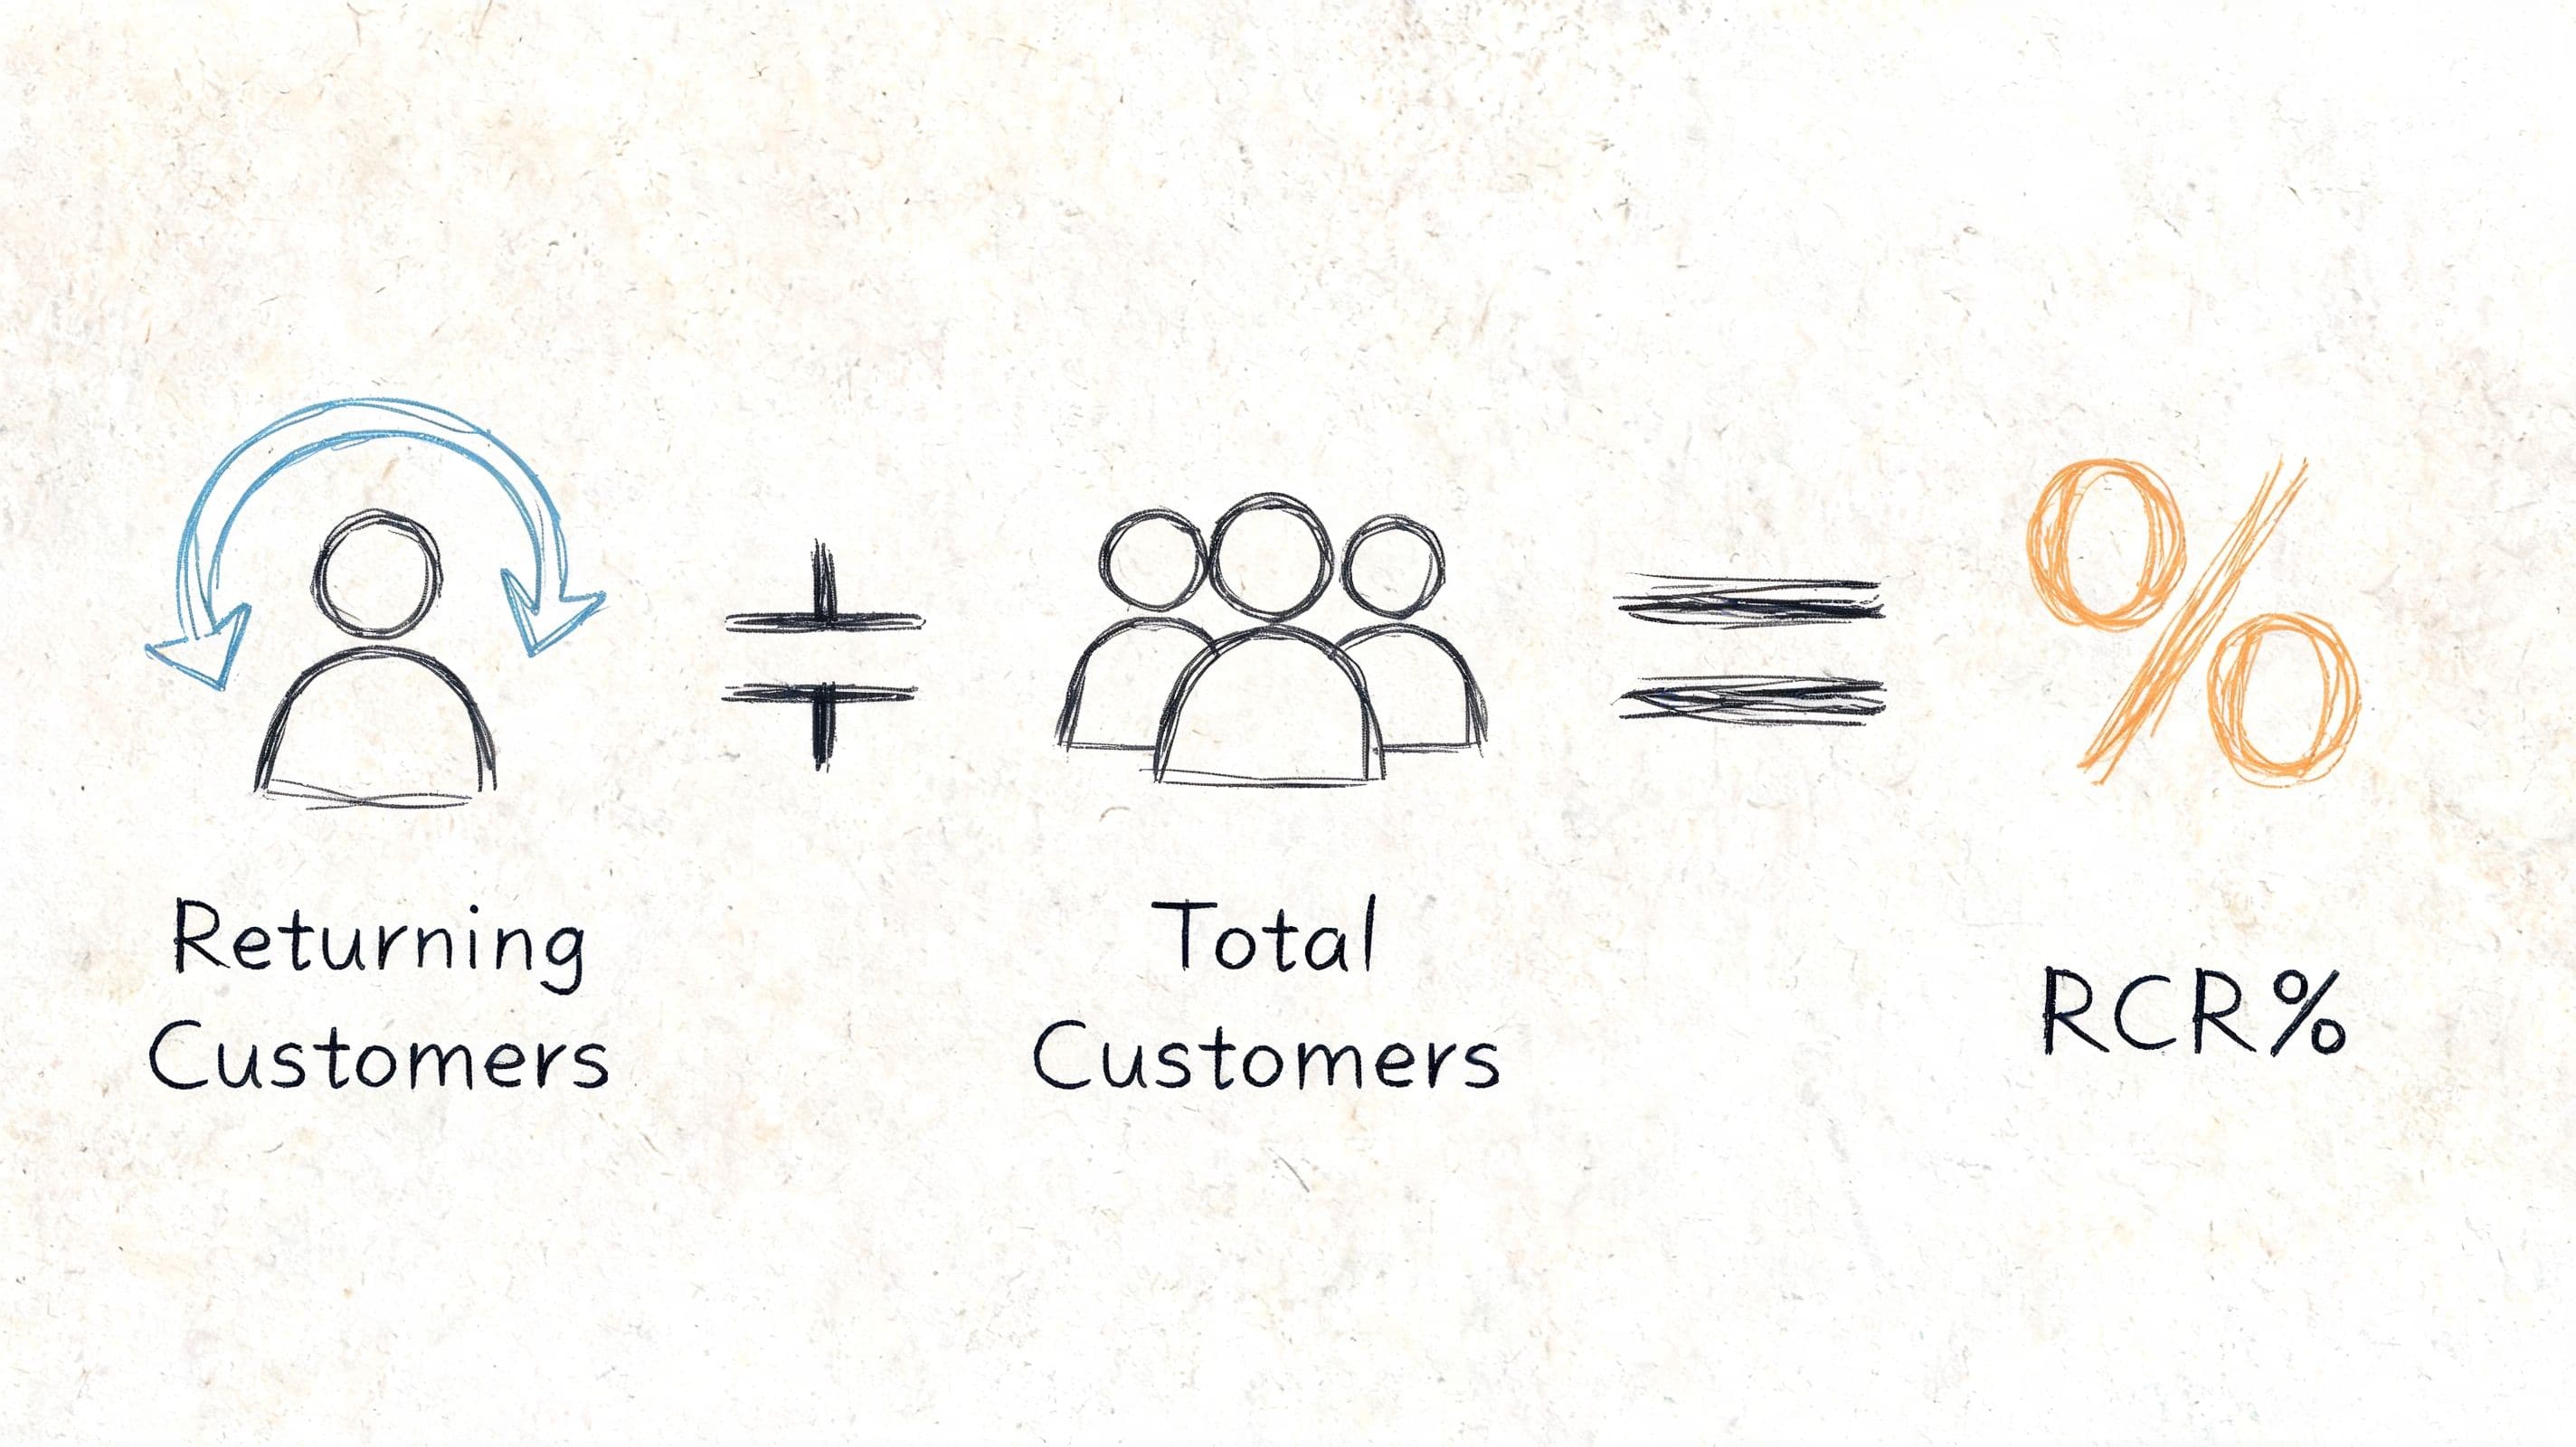
The formula is:
Returning Customers ÷ Total Unique Customers × 100
Start with a clean definition
A returning customer should mean a paying customer with a completed transaction who purchased again within the time window you’re measuring. It should not include account signups, email subscribers, or abandoned carts. That definition discipline matters because loose reporting makes the metric look healthier than it is.
The time window matters too. Monthly RCR is useful for operating cadence. Cohort tracking is better for understanding whether the customers you acquired in a given month stick. If you mix definitions from report to report, you’ll create noise and chase the wrong fix.
There’s also a trap on the other side. An unusually high number isn’t automatically good. An abnormally high RCR of 50%+ often signals weak new customer acquisition, while 20-30% monthly repeat purchase rates are commonly used as sustainable profitability benchmarks, as outlined in Geckoboard’s KPI guide.
Don’t celebrate a high returning customer rate until you’ve checked whether new customer volume is shrinking.
If you want another practical breakdown of retention math and how it connects to repeat behavior, CartBoss helps boost customer loyalty with a useful walkthrough that complements Shopify reporting well.
How to pull the number in Shopify and GA4
In Shopify, start with the customer and sales reports in analytics. You’re looking for:
- Unique customers in a defined period
- Customers with repeat purchases in that same period
- A fixed date range you’ll use every month
A basic operating process works like this:
- Choose one reporting period. Monthly is the easiest place to start.
- Export the customer report so you can identify unique purchasers.
- Tag repeat purchasers based on order history, not account creation.
- Calculate the percentage using the formula above.
- Store each month’s result in a spreadsheet or dashboard so trend matters more than one snapshot.
In GA4, the exact path depends on how your store is configured, but the principle is the same. Build an exploration around purchasers, segment new versus returning users, and validate against Shopify order data. GA4 is helpful for behavior analysis before the purchase. Shopify is usually the cleaner source for transaction truth.
Use both carefully:
- Shopify tells you who bought and bought again.
- GA4 helps you see which channels, landing pages, and journeys tend to produce those buyers.
If the numbers don’t match exactly, don’t panic. Different tools define users differently. What matters is consistency in how you measure going forward.
What Is a Good Returning Customer Rate
This is the question every merchant asks right after they calculate it. The short answer is that a good returning customer rate depends heavily on what you sell.
A supplement brand with replenishment behavior should not judge itself by the same standard as a furniture brand. A fashion store with frequent seasonal drops will behave differently from an electronics store with longer replacement cycles. Category sets the baseline.
Benchmarks by category
According to G2’s overview of returning customer rate benchmarks, fashion and apparel average 25-26%, health and supplements can reach around 29%, home furniture sits at 14.7%, Shopify fashion can reach 33%, and electronics may be closer to 20%.
| Industry | Average RCR |
|---|---|
| Fashion and apparel | 25-26% |
| Health and supplements | ~29% |
| Home furniture | 14.7% |
| Shopify fashion stores | 33% |
| Electronics | 20% |
That table is useful because it stops merchants from applying one generic benchmark to every store. If you sell products with natural replenishment, you should expect more repeat behavior. If you sell expensive, infrequent-purchase items, lower repeat frequency may be perfectly normal.
Use the table as context, not a verdict
Benchmarks are a starting point. Your own trendline matters more.
I’d rather see a store improve its returning customer rate steadily against its own baseline than hit a category average by discounting too aggressively or training customers to wait for offers. The cleaner question is this: are more of your customers choosing to come back, and are they doing it for healthy reasons?
For merchants who want a second lens on retention planning beyond raw percentages, Toki has a practical guide for growing your store that helps frame retention as an operating system, not just a report.
Use category benchmarks to set expectations. Use your own month-over-month and cohort trends to make decisions.
Diagnosing the Cause of a Low RCR
A low returning customer rate doesn’t tell you what to fix. It only tells you where to look. The diagnostic work starts when you compare the metric to what customers experience after they buy.
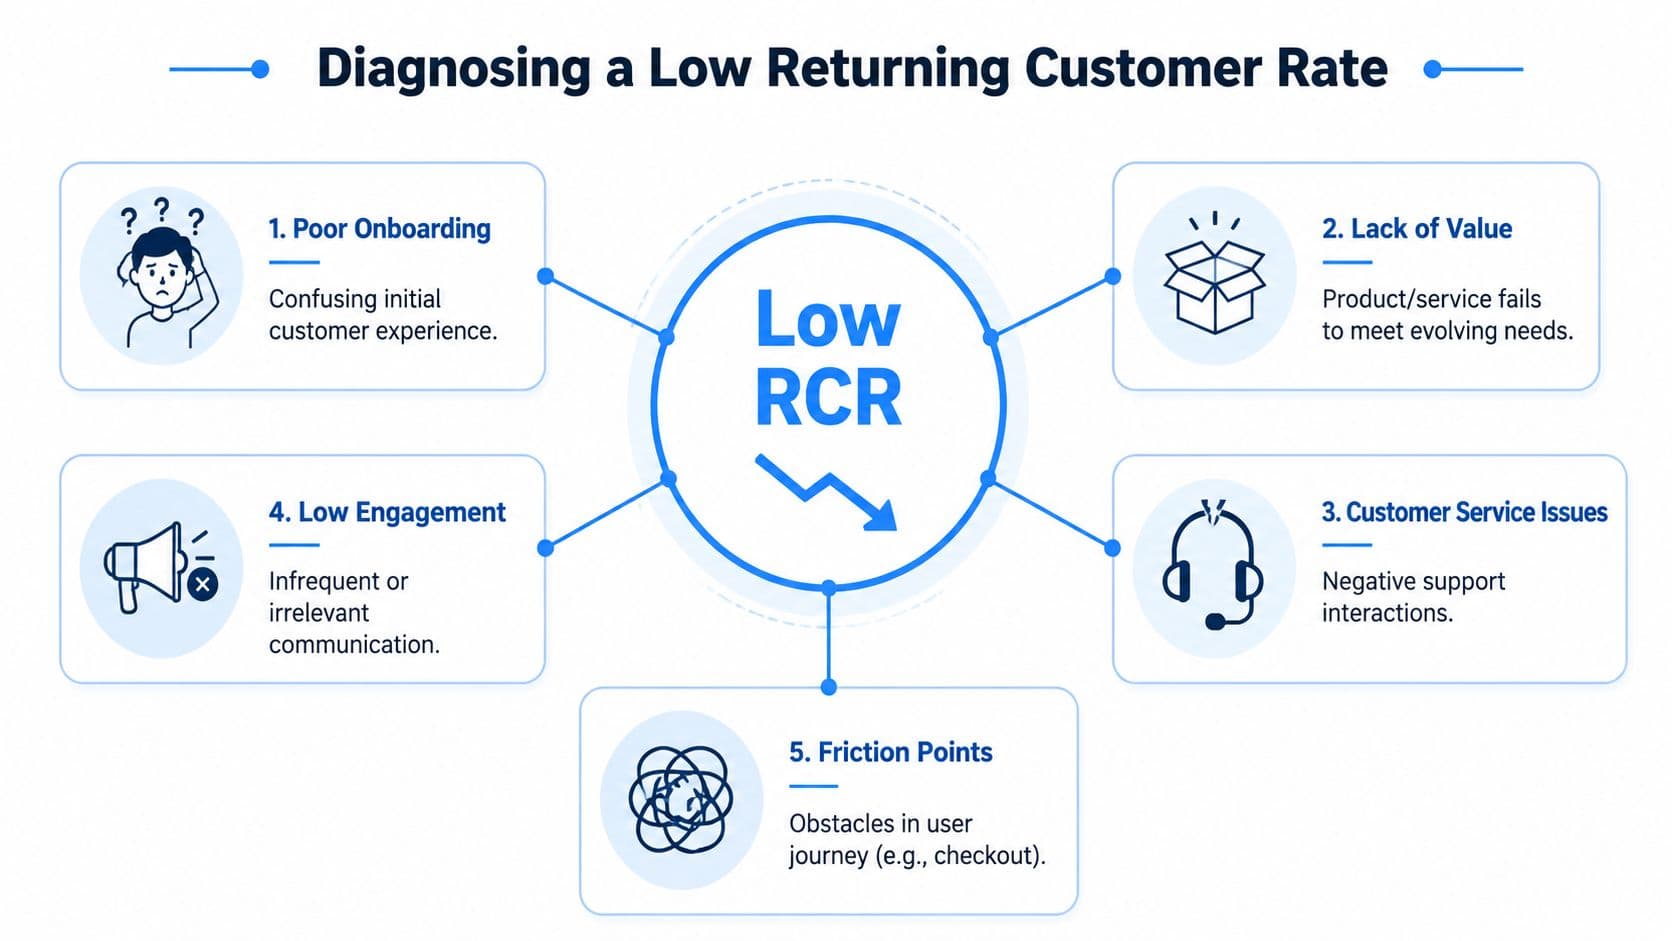
The five failure patterns I see most often
1. The first order was fine, not memorable
This is common in stores with decent conversion and weak follow-up. The product arrives, nothing goes wrong, but nothing creates a reason to return either. No replenishment reminder, no useful education, no relevant cross-sell, no reason to keep browsing.
2. Returns and exchanges create friction This one erodes retention. According to the National Retail Federation’s 2025 returns landscape research, 84% of customers say they can’t imagine returning to a brand after a poor return experience. If customers hit policy confusion, slow approvals, or support delays when something goes wrong, they often leave for good.
3. Your aggregate RCR hides silent churn
Some stores look healthy at the top line because enough customers come back once. Then they disappear. That’s the hidden problem often called silent churn: a store can show a seemingly acceptable repeat rate while second-order customers fail to become third-order customers. If you only track aggregate RCR, you won’t see it.
4. The product category attracts low natural frequency Sometimes the number is low because the purchase cycle is long. In those stores, the main task isn’t forcing another fast purchase. It’s staying relevant until the next natural buying moment.
5. Repeat customers return, but buy weak baskets
This is a different problem. You may have repeat behavior, but not enough repeat value. Customers come back for lower-priced or lower-margin items, so revenue stalls even when RCR looks respectable.
What your store data is usually trying to tell you
Use this checklist when diagnosing:
- Look at second-order timing: If many customers buy once and vanish, your issue is usually onboarding, product expectation, or follow-up relevance.
- Review support logs: Repeated questions about sizing, compatibility, shipping, and return rules usually point to content gaps that suppress trust.
- Inspect return reasons: If exchanges, fit issues, or policy confusion dominate, returns friction is likely hurting repeat intent.
- Compare cohorts, not just totals: Aggregate metrics blur the difference between good acquisition and sticky acquisition.
- Check repeat order composition: If repeat baskets skew toward low-value items, merchandising and recommendation strategy may be the bottleneck.
A low returning customer rate rarely has one cause. But it usually has one dominant bottleneck.
That’s the key distinction. Don’t solve a returns problem with more email. Don’t solve a weak product fit problem with a points program. Diagnose first, then match the tactic.
7 Proven Tactics to Increase Returning Customers
Once you know the cause, improving returning customer rate gets much more practical. The stores that make progress don’t run every retention play at once. They pick the lever that matches the failure pattern and execute it consistently.
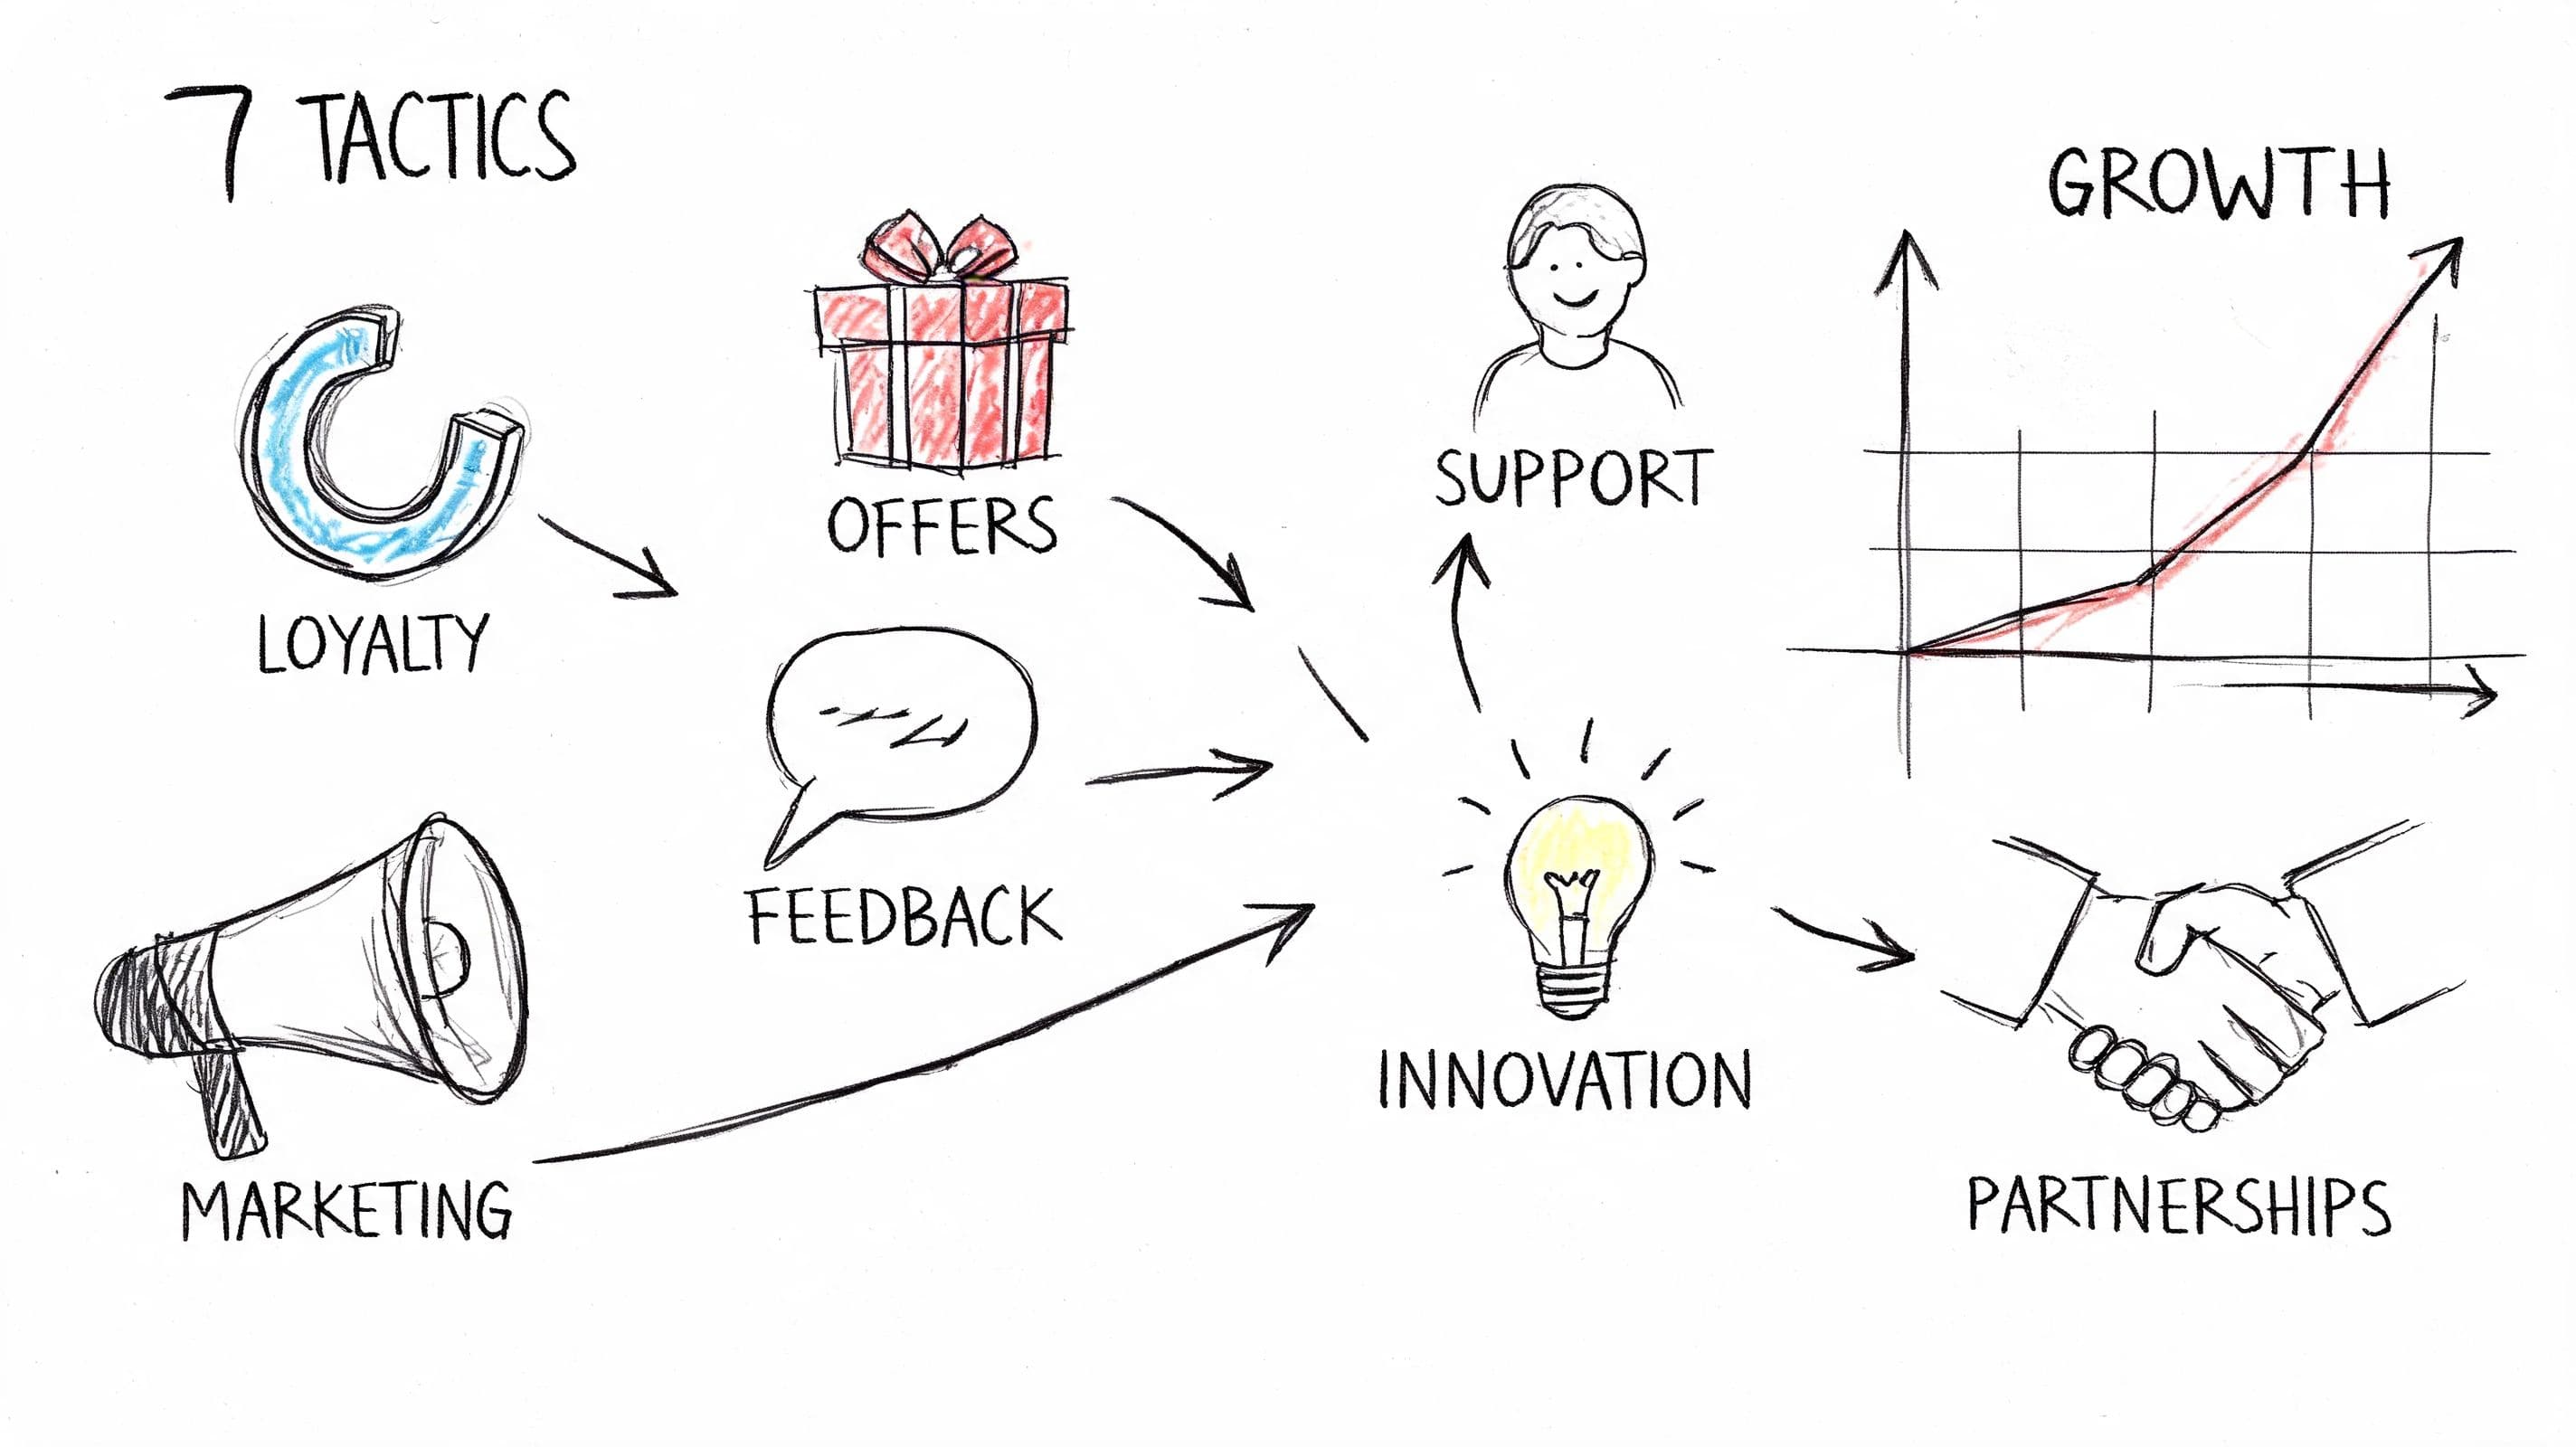
Match the tactic to the problem
1. Fix the post-purchase gap
If customers buy once and then hear nothing useful, build a tighter post-purchase flow. Focus on education, usage tips, care instructions, reorder timing, and complementary products. The job isn’t to send more messages. It’s to send the next helpful message.
2. Remove returns friction If support is spending time on exchanges, damaged-item confusion, or policy explanations, simplify the path. Make the return policy readable, visible, and consistent with what support does. Many merchants overlook how much preventable churn starts after the order is delivered, not before. Reading about how live cart data prevents customer churn can help connect browsing behavior with retention signals earlier in the journey.
3. Use loyalty carefully
Loyalty programs work when they reinforce an existing habit. They work poorly when they try to manufacture one. If customers don’t yet love the product or trust the experience, points won’t solve the root issue.
4. Improve merchandising for repeat visits
Returning customers shouldn’t see the store the same way first-time visitors do. Feature restocks, refills, category continuations, and products that fit prior purchases. If someone bought skincare, don’t send them back to a generic homepage. Send them to the next logical decision.
Choose one lever and run it well
5. Add proactive onsite assistance for returning visitors
A lot of repeat purchase friction happens in tiny moments. “Will this fit the same as my last order?” “Do you still carry the version I bought before?” “What goes with this?” Tools that answer those questions fast can improve the quality of repeat sessions. One option is Carti’s post-purchase behavior guide, which is useful if you’re mapping what returning shoppers do between orders. In practice, merchants often pair that analysis with onsite help such as product answers, suggestions, and cart nudges so repeat visitors don’t stall out.
6. Build win-back flows based on behavior, not just time
A generic “we miss you” email is usually lazy retention. Better win-back logic starts with what the customer bought, how long that product typically lasts, and what question they’re likely to have next. Segment by behavior. Send fewer, more relevant messages.
A simple pattern works well:
- After a first purchase: Focus on reassurance and product success.
- Before a likely reorder window: Send utility, not a discount first.
- After inactivity: Use an offer only when relevance alone didn’t pull them back.
Here’s a useful visual primer before you redesign that flow:
7. Ask for customer feedback where churn happens
Don’t only survey your happiest buyers. Ask for input after a return, after support interaction, after a delayed shipment, or after an exchange request. Those moments reveal why customers don’t come back.
Field note: The best retention tactics usually look boring. Clear policies, relevant follow-up, better merchandising, and fast answers beat flashy campaigns more often than merchants expect.
If you only implement one tactic this quarter, choose the one that removes friction from the second purchase. That’s where many stores either create a habit or lose the customer.
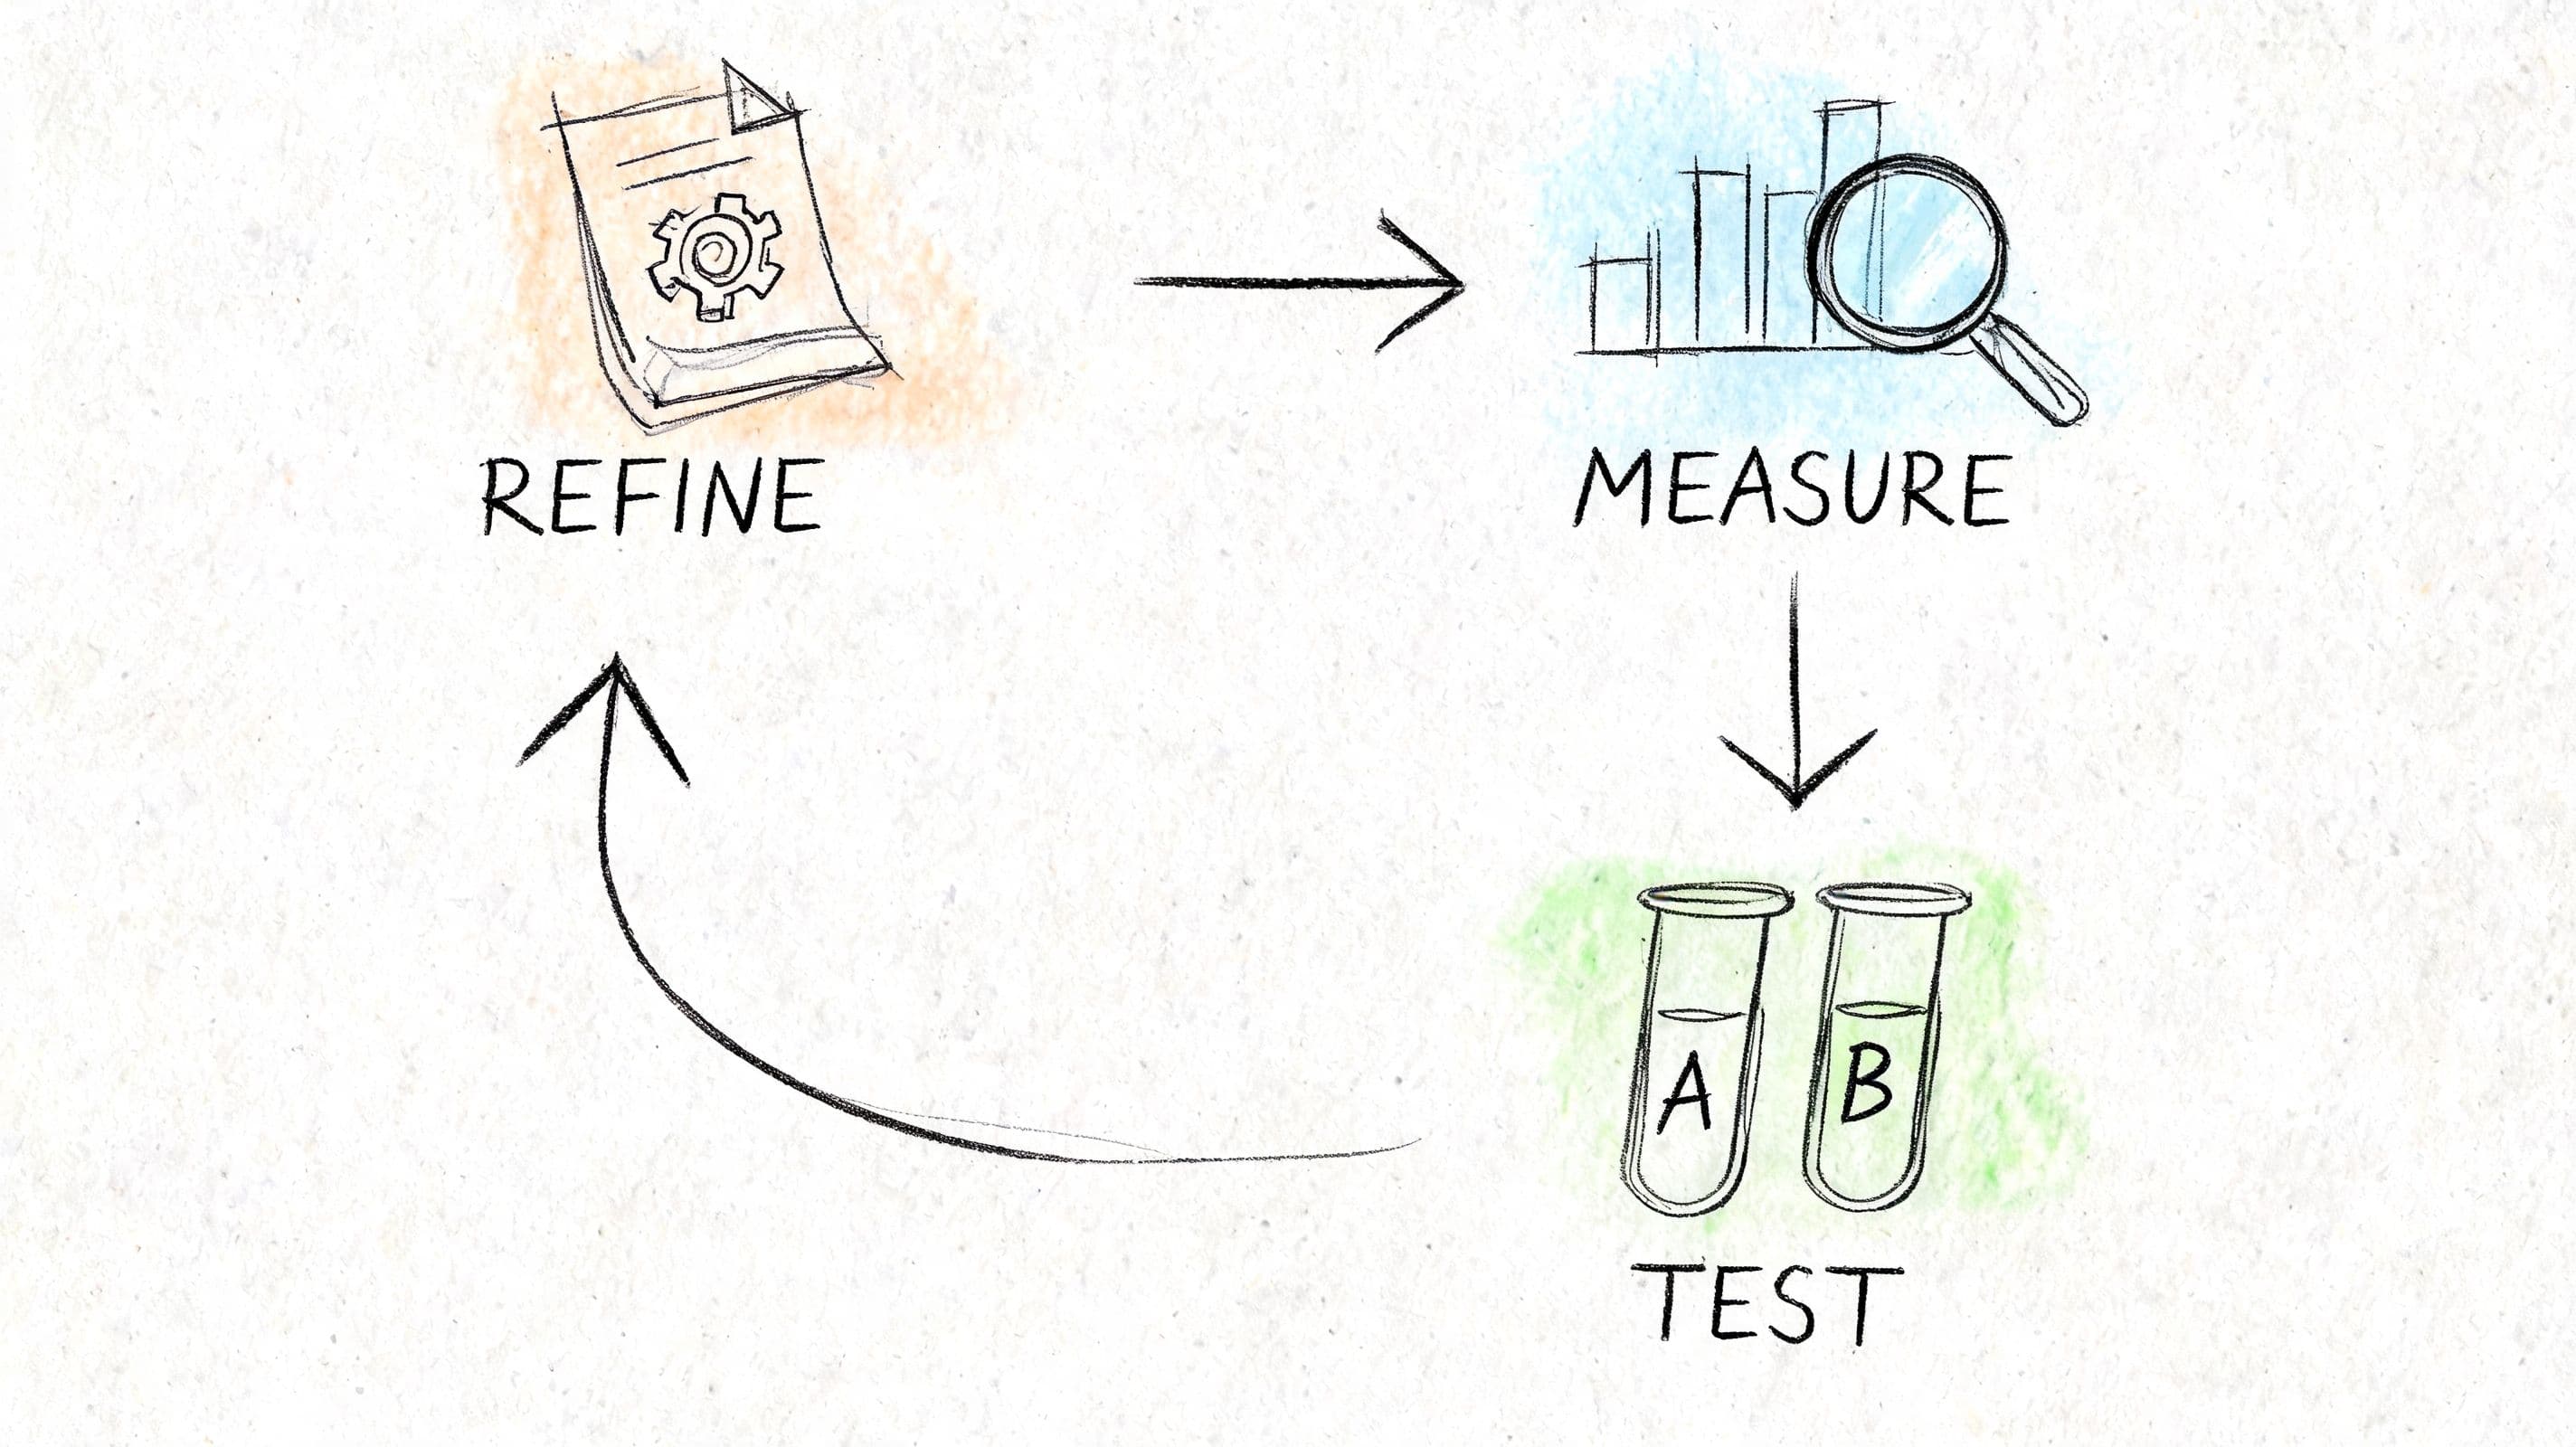
How to Measure and Test Your Retention Strategy
Retention work falls apart when merchants launch tactics but never isolate what changed. If you don’t measure the impact of one intervention against a clean baseline, you end up with opinions instead of learning.
Build a simple retention scorecard
You don’t need a complex BI stack to manage this. A spreadsheet, Shopify export, and a basic dashboard in Looker Studio are enough if the definitions stay consistent.
Track these fields every month:
| Retention dashboard view | What to watch |
|---|---|
| Returning customer rate | Trend by month and by cohort |
| Repeat order value | Whether repeat revenue quality is improving or slipping |
| Time between purchases | Whether repeat intent is speeding up or slowing down |
| Return and exchange friction | Questions, complaints, and policy confusion themes |
| Channel quality | Which acquisition sources produce buyers who come back |
The dashboard should answer two questions. First, are more customers returning? Second, are they returning in a way that improves the business?
For a broader measurement framework, Carti’s guide to e-commerce key performance indicators is a solid reference for deciding which retention-adjacent metrics belong beside RCR instead of treating it as a standalone number.
Tests worth running first
Good retention testing is small, controlled, and tied to a clear hypothesis.
Try tests like these:
- Post-purchase email sequence: Compare education-first messaging against discount-first messaging for first-time buyers.
- Repeat visitor homepage experience: Show replenishment or personalized category recommendations to returning visitors and compare against a generic homepage.
- Return policy placement: Test whether clearer policy visibility reduces support friction and improves repeat intent qualitatively.
- Win-back trigger timing: Compare an earlier reminder versus a later reminder for products with predictable reorder patterns.
- Onsite support prompt: Test a proactive question for returning visitors against a passive support widget.
Measure one primary outcome per test. If you test everything at once, you won’t know what caused the change.
Keep a simple testing log with the hypothesis, audience, start date, end date, observed result, and next action. Most retention gains come from compounding small fixes, not from one giant breakthrough.
From Metric to Mission Your Path to Profitable Growth
Returning customer rate works best when you stop treating it like a report you glance at once a month. It should shape how you review acquisition quality, post-purchase experience, customer support, merchandising, and returns.
The operating sequence is straightforward. Measure the number cleanly. Compare it against a relevant baseline. Diagnose the cause of weakness. Choose the tactic that fits the cause. Test the result. Then repeat with more precision.
That approach is what keeps merchants from wasting money. A weak second-purchase journey needs different work than a weak returns process. A low-frequency category needs different expectations than a replenishment business. Once you accept that, the metric becomes useful.
The biggest shift is mental. Don’t ask, “How do I get my returning customer rate up?” Ask, “What is this number telling me about the experience customers have after the first order?” That question leads to better decisions.
Pick one bottleneck this week. If returns are messy, fix the policy and handoff. If repeat visits are weak, improve the onsite experience for returning shoppers. If silent churn is hiding in the data, start cohort tracking. That’s how retention becomes profitable growth instead of another dashboard tile.
Frequently Asked Questions About RCR
How often should I measure returning customer rate
Measure it monthly for operating rhythm, then review it by cohort on a recurring basis so you can see whether newly acquired customers continue buying over time. Monthly reporting is frequent enough to catch trend changes without overreacting to short-term noise.
If your store has strong seasonality or longer purchase cycles, widen the analysis window when needed. The goal is consistency, not forcing every category into the same cadence.
What is the difference between RCR and churn
Returning customer rate tells you how many customers came back and bought again within a defined period. Churn tells you who stopped buying or disengaged over time.
They answer different questions. RCR is useful for understanding repeat purchase behavior. Churn is useful for understanding attrition. In practice, merchants need both, because a store can have a passable repeat rate while still losing too many customers after the second order.
| FAQ | Answer |
|---|---|
| How often should I track RCR? | Monthly works for most Shopify stores, with cohort reviews layered on top. |
| Is RCR the same as retention rate? | No. RCR focuses on repeat purchasers in a period. Retention rate tracks how many customers remain over time. |
| Should I compare my RCR to every other store? | No. Compare it to category context and your own trend first. |
Can a high returning customer rate be a bad sign
Yes. A high number can reflect healthy loyalty, but it can also mean new customer acquisition is too weak. If too much of your revenue depends on the same existing buyers, growth can flatten and acquisition problems stay hidden.
That’s why I never evaluate RCR alone. Pair it with new customer volume, repeat order value, and cohort trends. A balanced store needs both retention and fresh demand.
If you want help turning returning customer rate from a static KPI into an active conversion system, Carti can support that work with AI-powered answers, product suggestions, and shopper insights inside your Shopify store. The practical use case is simple: reduce friction when returning visitors have questions, help them find the right product faster, and learn which recurring concerns are blocking repeat purchases.

Written by
Daniel AndersonFounder of Carti. 10+ years building ecommerce brands in apparel and supplements. Still runs a Shopify store and built Carti to help merchants convert more browsers into buyers.
Ready to boost your store's sales?
Install Carti in 5 minutes and let AI handle customer questions, recommend products, and close sales 24/7.
Start Free Trial14-day free trial