
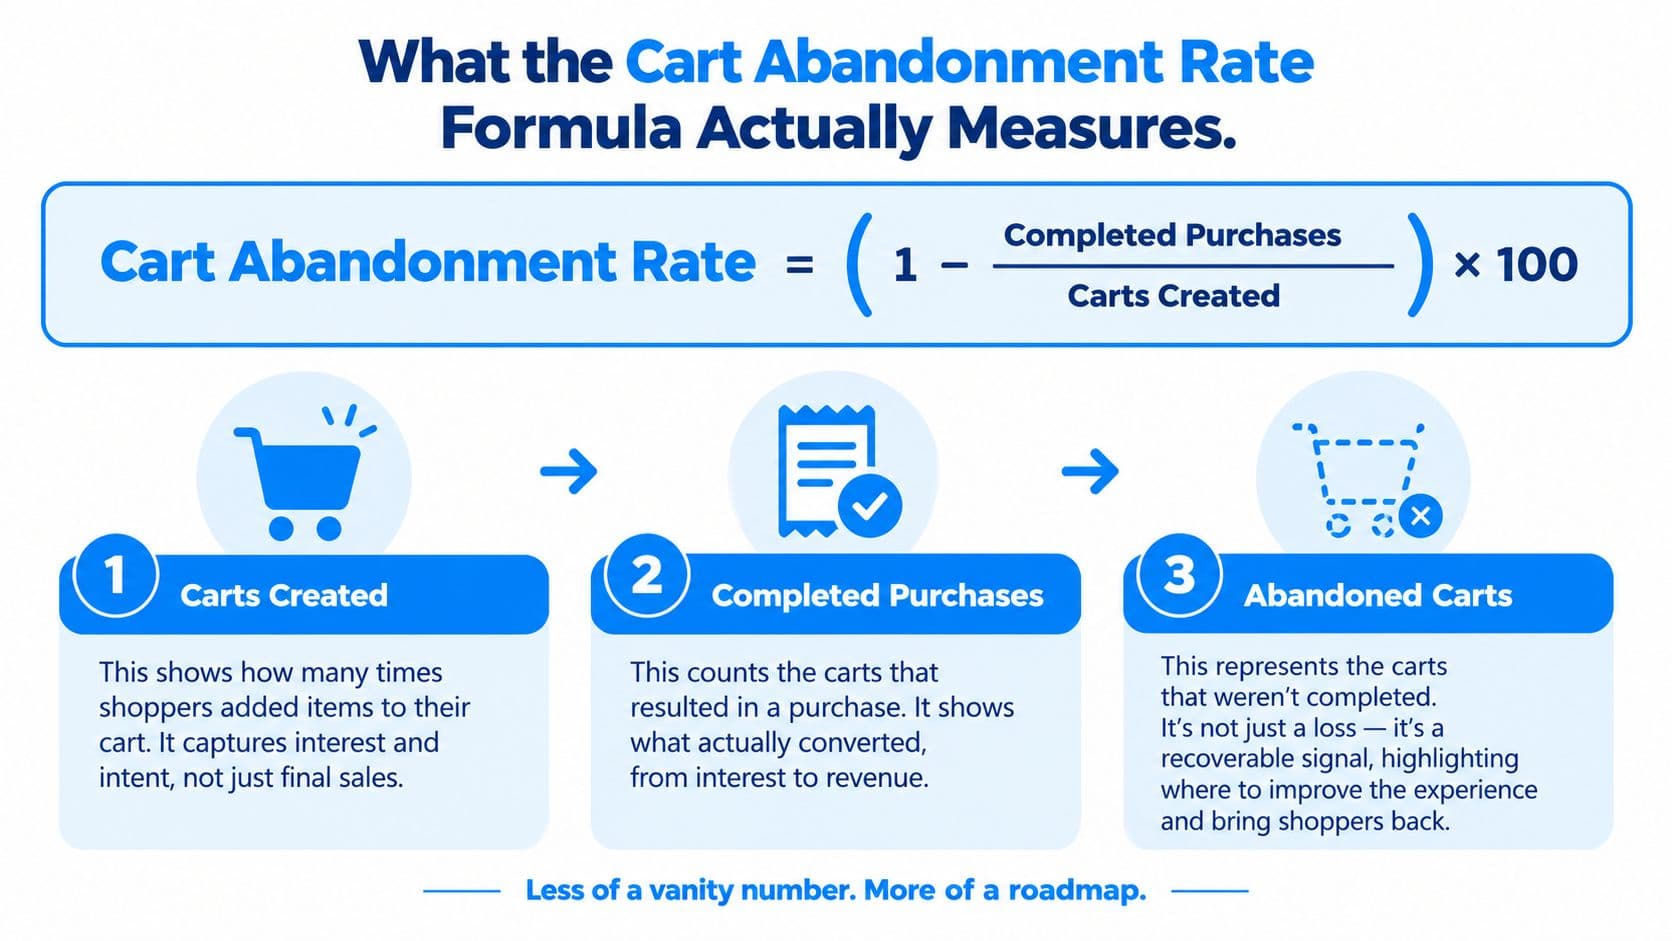
The cart abandonment rate formula is (1 − completed purchases ÷ carts created) × 100. The denominator is where most stores get the number wrong, because “cart created” can mean different things across Shopify reports and analytics tools.
A 2026 Shopify benchmark reports 76.04% abandonment across 958 stores and more than 24 million visitors, while broader estimates cluster around 70.2% globally. Those figures aren't contradictory. They measure different populations and may apply different definitions of a cart, which is why the formula is less about difficult math and more about disciplined measurement.
What the Cart Abandonment Rate Formula Actually Measures
The headline equation is simple:
Cart abandonment rate = (1 − completed purchases ÷ carts created) × 100
The calculation estimates how many shoppers who created a cart failed to complete a purchase during the selected measurement window. For a Shopify operator, that creates a useful funnel-health metric. It shows whether purchase intent is turning into orders, but only when both inputs describe the same shopper behavior and the same period.
The numerator is completed purchases. Use orders that were successfully processed in the reporting window, and make sure the purchase event comes from the same analytics system as the cart event whenever possible. The denominator is carts created, not website sessions, product views, add-to-cart clicks in every possible definition, or checkout starts.
Why the denominator changes the story
Some tools define the metric as completed purchases divided by shopping carts created. Others focus on add-to-cart sessions that don't convert. A Shopify-focused benchmark described in Shopify's checkout optimization guidance counts a cart as abandoned only when a shopper adds a product and doesn't start checkout within 1 hour.
That distinction can produce very different results for stores with similar buying behavior. A store with many casual add-to-cart actions may report a higher abandonment rate than a store that counts only shoppers who reach checkout.
Practical rule: Write down what creates a cart, what completes a purchase, and when abandonment becomes final before you compare the metric with another store.
Use the number to diagnose funnel health, not to win a benchmark argument. Segment it by device, traffic source, and checkout behavior, then document the definition beside every report. For additional context on overcoming high checkout drop-off, compare the cart stage with the later checkout stages. Shopify operators can also map this metric against the broader ecommerce conversion funnel to see whether the problem starts before checkout or inside it.
Calculating the Formula Step by Step With Real Numbers
The arithmetic takes seconds. The work is selecting inputs that represent the same funnel stage.
Start with a fixed date range, such as a calendar month. Pull the number of carts created in that period, pull completed purchases from the same period, and confirm that both reports use the same store timezone. Then apply the formula without mixing cart creation from one window with orders from another.
The available benchmark data offers a useful worked interpretation. The Shopify benchmark reports 76.04% abandonment, which means the corresponding completed-purchase share is 23.96% under that benchmark's definition. The exact cart and purchase counts behind that percentage aren't provided in the verified data, so they shouldn't be reverse-engineered into invented store totals.
| Input | Small DTC Store | High-Traffic Apparel Store |
|---|---|---|
| Cart definition | Confirm in Shopify analytics | Confirm in Shopify analytics |
| Date range | Use one fixed reporting window | Use the identical reporting window |
| Carts created | Export the platform's cart-created event | Export the platform's cart-created event |
| Completed purchases | Match orders to the same window | Match orders to the same window |
| Formula | (1 − purchases ÷ carts) × 100 | (1 − purchases ÷ carts) × 100 |
| Result | Calculate from the store's verified inputs | Calculate from the store's verified inputs |
A clean operating procedure
-
Lock the event definition. Decide whether the denominator is a cart-created event, an add-to-cart session, or another documented event. Don't switch definitions midway through a trend report.
-
Match the time window. If a cart is created near the end of the period and converts later, your platform's attribution rules may place the cart and order in different windows. Keep the reporting method consistent rather than moving orders between periods.
-
Check duplicates and exclusions. Test whether refreshed pages, returning shoppers, bots, test orders, and cancelled orders enter either input. A rate can look better or worse when the event stream contains duplicates.
-
Calculate, then segment. The blended number is only a starting point. Compare mobile with desktop, paid traffic with organic traffic, and cart creation with checkout starts.
A smaller store shouldn't compare its result directly with a larger store until both businesses have aligned these rules. Volume alone doesn't make a rate better. The metric reflects the relationship between the selected cart population and the completed orders attributed to it.
The Four Denominator Traps That Distort Your Number
Most reporting errors happen before anyone touches the formula. Teams export a familiar dashboard field, assume it means “cart,” and compare the result with a benchmark built on a different event.
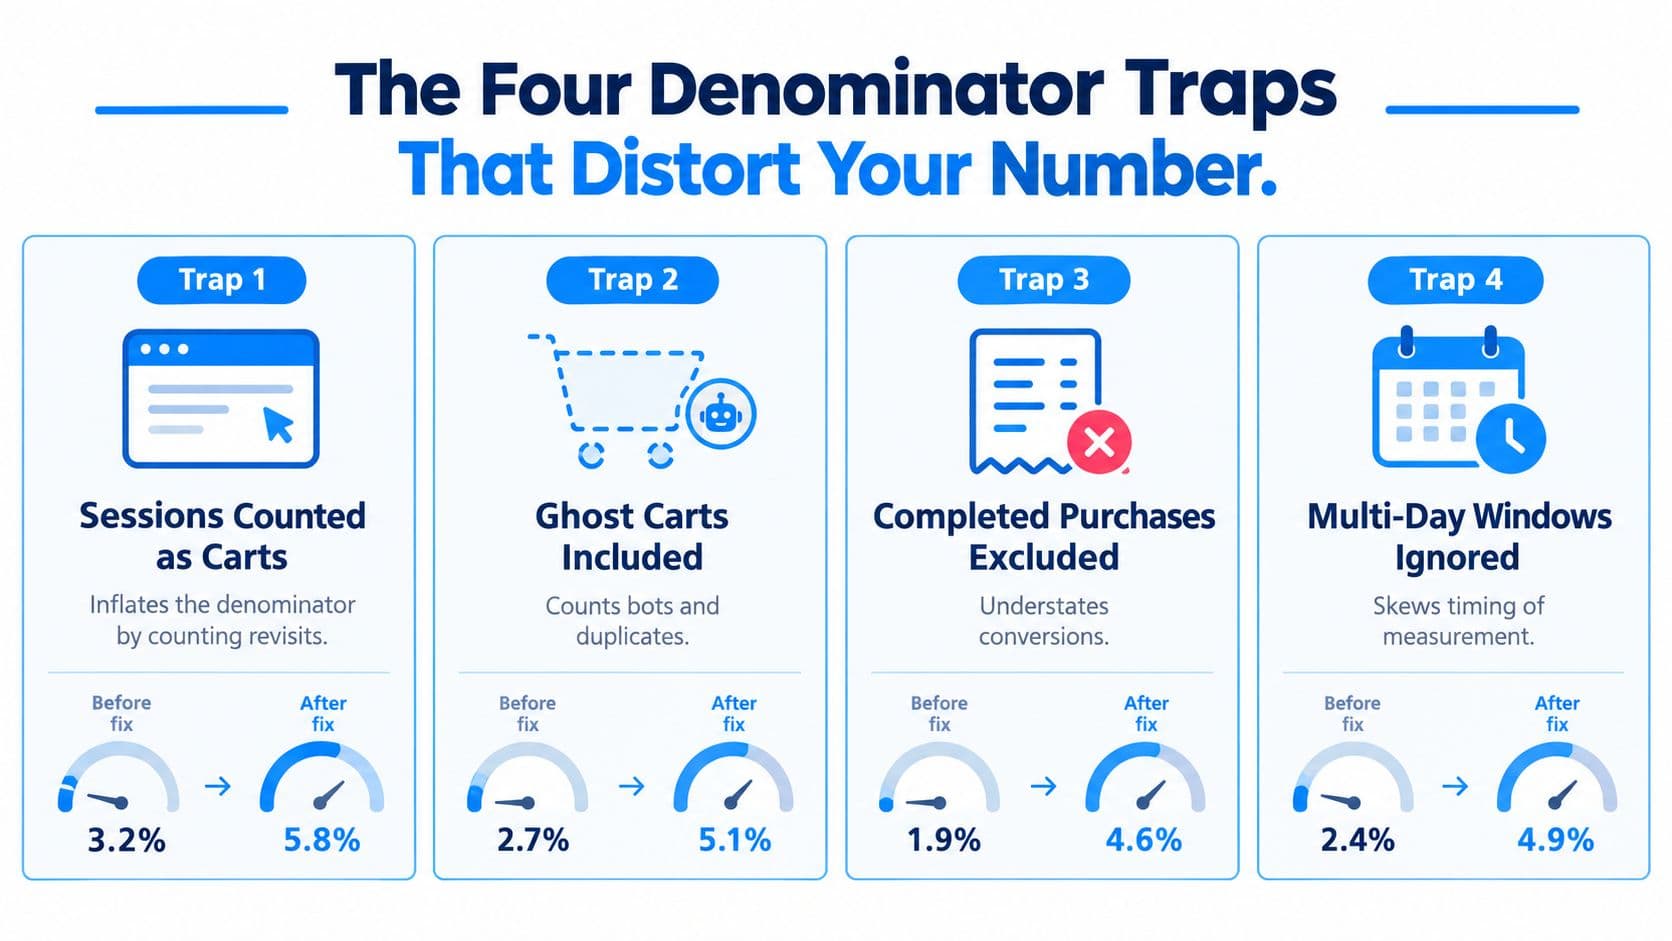
Trap one, counting sessions instead of carts
A session can contain browsing without any purchase intent. If you put sessions in the denominator, you aren't measuring cart abandonment anymore. You may dilute the rate by including shoppers who never added a product.
Trap two, treating every cart event as a unique cart
Repeated add-to-cart events, page refreshes, bots, and duplicate tracking can inflate the denominator. Review the event logic and exclude obvious test activity. If suspicious order activity affects your store, use a practical guide to stop fake orders on Shopify, then verify that the same exclusions apply to cart reporting.
Trap three, mixing cart and checkout populations
A cart-created event captures earlier intent than a checkout-start event. Combining them produces a blended denominator with no stable meaning. Keep cart abandonment and checkout abandonment as separate metrics, then use them together to locate the drop-off.
Trap four, ignoring the abandonment window
The one-hour checkout-start rule is a clear example of how timing changes the metric. A store may count a cart as abandoned after a short period, while another waits longer or includes later activity. Multi-day behavior, returning shoppers, and delayed decisions can therefore create large differences between otherwise similar stores.
The right response isn't to find one universal denominator. It's to publish the definition beside the rate, preserve it over time, and label any benchmark comparison with the measurement rule used.
2026 Benchmarks by Vertical and Device
A benchmark only helps when its denominator, event definition, and abandonment window match yours. Verified data does not provide a complete numerical table for nine verticals, so assigning rates to apparel, beauty, electronics, home goods, food and beverage, health, pet, luxury, or DTC subscription would create false precision.
The clearest available signal is device performance. One 2026 dataset reports 76.98% mobile abandonment versus 64.78% on desktop, a 12.2-point gap (Ringly). The same source places global abandonment at roughly 70.22% across 50 studies. A separate Shopify benchmark reports a different result using its own methodology, so use it as directional context rather than a target for your store.
| Vertical | Desktop Rate | Mobile Rate | Mobile Gap |
|---|---|---|---|
| Apparel | Not provided in verified data | Not provided in verified data | Not provided |
| Beauty | Not provided in verified data | Not provided in verified data | Not provided |
| Electronics | Not provided in verified data | Not provided in verified data | Not provided |
| Home goods | Not provided in verified data | Not provided in verified data | Not provided |
| Food and beverage | Not provided in verified data | Not provided in verified data | Not provided |
| Health | Not provided in verified data | Not provided in verified data | Not provided |
| Pet | Not provided in verified data | Not provided in verified data | Not provided |
| Luxury | Not provided in verified data | Not provided in verified data | Not provided |
| DTC subscription | Not provided in verified data | Not provided in verified data | Not provided |
How to use the benchmark responsibly
Use the device split to choose where to investigate, not to set a universal target. If your mobile rate is materially higher than desktop, inspect thumb-friendly form fields, page stability, wallet availability, shipping clarity, and checkout loading. A high mobile rate may reflect checkout friction, weak tracking, or a different shopper mix rather than a problem with recovery messaging.
Keep your own definition unchanged and record the baseline each week. Compare your cart metric with Shopify conversion rate benchmarks, but label the denominator and event window beside every comparison. That prevents a checkout-start benchmark from being mistaken for a cart-created benchmark.
Recovery timing also depends on the stage you measure. Use guidance on reducing cart abandonment with SMS after identifying whether shoppers hesitate before checkout or leave after entering it. The benchmark should determine the investigation order, not dictate the tactic.
Using the Metric to Prioritize Recovery Tactics
A headline abandonment rate doesn't tell you what to build next. The useful question is which intervention can increase completed purchases without corrupting the denominator.
Start with measurement hygiene. It costs less than new software and often reveals that a sudden change came from event tracking, a checkout rule, or a reporting-window mismatch. Once the number is stable, score potential fixes by effort, proximity to the drop-off, and ability to isolate the result.
| Recovery lever | Where it acts | Effort | How to evaluate it |
|---|---|---|---|
| Exit-intent message | Before the shopper leaves | Low to medium | Compare exposed and unexposed carts |
| Email or SMS reminder | After abandonment | Medium | Attribute recovered purchases to the sequence |
| Guest checkout and address autofill | During checkout | Medium | Compare checkout completion before and after release |
| Wallet and payment expansion | Payment stage | Medium to high | Segment by device, location, and payment method |
| On-site conversational assistance | During hesitation | Medium | Track assisted carts and completed purchases |
Match the tactic to the input it changes
Checkout fixes primarily increase completed purchases. Better payment coverage can remove a final-stage obstacle, while guest checkout and address autofill reduce manual work. These changes should be measured against checkout starts, not only against the blended cart rate.
Email and SMS act after a shopper has left. They can bring a shopper back and create a completed purchase, but they won't repair a broken mobile form or an unclear shipping total. Keep recovered orders attributed to the right campaign so the overall rate doesn't take credit for an unrelated conversion.
Exit-intent prompts can help when hesitation is visible, but discounts aren't a substitute for clarity. An offer may recover a sale while reducing margin or training shoppers to wait. Test reassurance, delivery information, returns, and product answers before making price concessions the default.
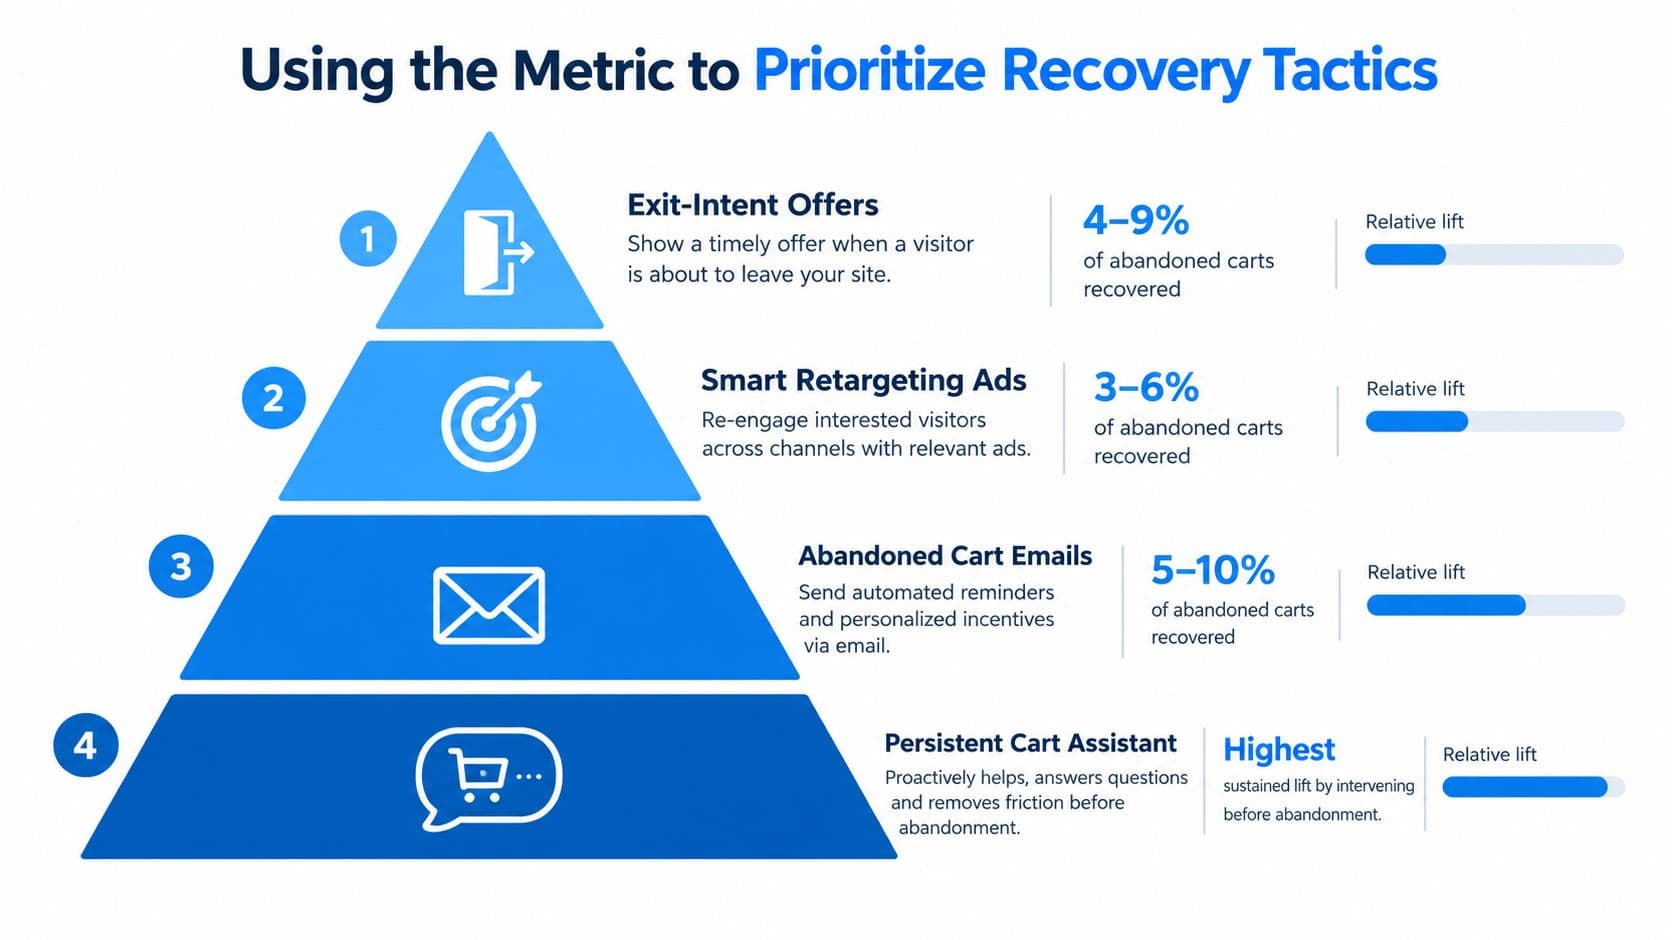
Prioritization rule: Fix the measurement first, then remove friction at the stage where the largest qualified shopper group exits.
For a 30-day roadmap, ship one low-effort checkout improvement, one controlled recovery flow, and one device-specific test. Change one major variable at a time. Otherwise, a lower rate may reflect overlapping campaigns rather than a durable improvement.
How Carti's Cart Recovery Moves the Formula
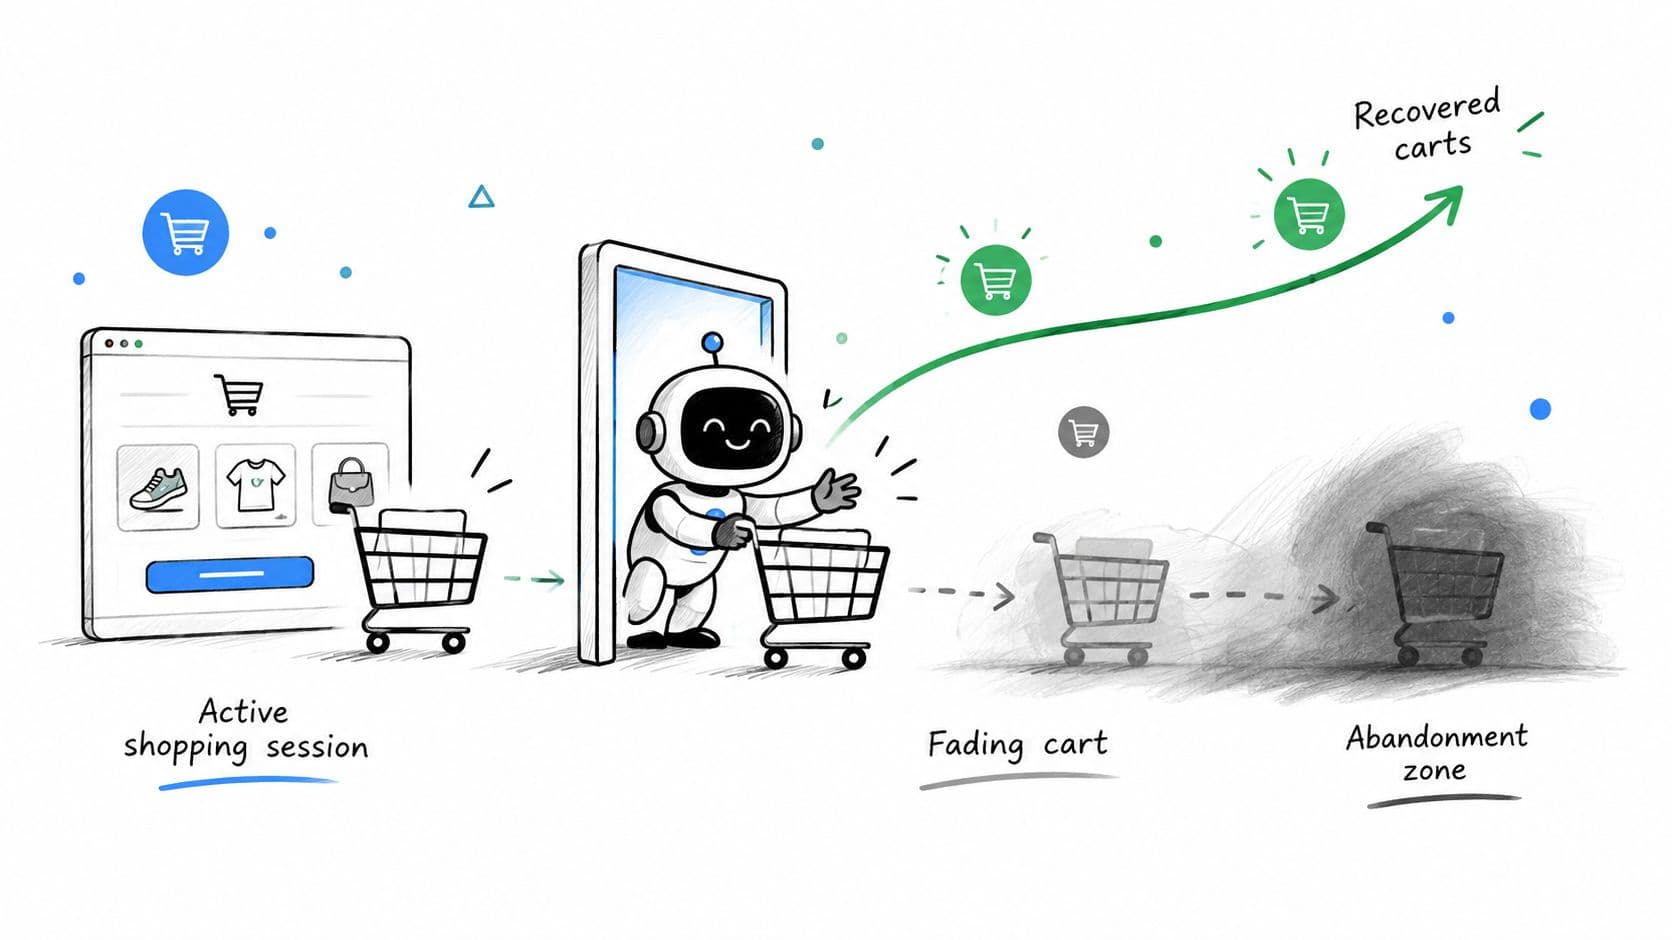
Most recovery programs wait until the cart is already classified as abandoned. Carti's Cart Recovery takes a different position by engaging a hesitant shopper during the buying journey, when a question or stalled checkout field may still be recoverable.
The measurement logic is straightforward. If an assisted conversation turns an existing cart into an order, completed purchases increase while carts created remain unchanged. That compresses the abandonment rate mathematically, provided the purchase is recorded in the same system and reporting window.
What the intervention should resolve
A recovery assistant is useful when it answers the objection blocking the next step. That may involve product fit, policy questions, delivery information, or uncertainty about which item to choose. The operational test isn't whether the chat opens. It's whether assisted shoppers progress from cart to checkout and from checkout to a completed order.
Review assisted and unassisted cohorts separately. Check whether the assistant attracts low-intent browsing, whether its prompts interrupt high-intent shoppers, and whether attributed orders appear in the same purchase report used for the cart abandonment rate formula.
Email and SMS remain valuable because they reconnect with shoppers after departure. They also require consent, accurate contact capture, deliverability, and sensible timing. On-site assistance has a different trade-off: it can address uncertainty earlier, but poor prompts or irrelevant recommendations can add friction.
The revenue attribution framework is useful when several recovery channels touch the same shopper. Without an attribution rule, teams may count the same order for a chat, an email, and a retargeting campaign.
See how the recovery experience can fit into a Shopify storefront:
Evaluate the first month as a calibration period. Review prompts, unanswered questions, false positives, and assisted orders before changing the denominator or declaring success. The tool should make the existing metric more actionable, not create a second disconnected version of it.
Your 7-Day Cart Abandonment Recovery Plan
Use one week to establish a trustworthy baseline and launch a focused test.
-
Day 1, define the denominator. Document what counts as a cart, what counts as a completed purchase, the reporting timezone, and the abandonment window.
-
Day 2, export the baseline. Save carts created, completed purchases, and the calculated rate for the selected period. Keep the raw export so future changes can be audited.
-
Day 3, segment by device. Compare mobile and desktop using the same event definitions. If the mobile result is materially worse, inspect forms, page stability, wallet payment, and checkout usability before adding incentives.
-
Day 4, ship one friction fix. Choose the clearest low-cost issue, such as guest checkout, address autofill, or a wallet payment option. Don't bundle several checkout changes into one release.
-
Day 5, configure Carti. Install one Cart Recovery flow, define the shopper signal that triggers it, and review the answers it gives to common objections. Keep the first test narrow enough to attribute.
-
Day 6, test exit intent. Place one message on the cart page with a clear reason to continue. Start with reassurance or useful information before offering a discount.
-
Day 7, recalculate and document. Compare the new rate with the baseline, segment the result by source and device, and write the next test based on the largest qualified drop-off.
Check the formula weekly, review benchmark context monthly, and run a deeper funnel analysis quarterly. In the next hour, open your Shopify analytics, write down the exact cart-created event and purchase event you currently use, and calculate the rate from one consistent reporting window.
Carti provides Shopify merchants with an AI shopping assistant that answers product and policy questions, recommends relevant items, and supports Cart Recovery during shopper hesitation. Visit Carti to connect the recovery workflow to a clearly defined cart abandonment rate formula and start with one measurable test.

Written by
Daniel AndersonFounder of Carti. 10+ years building ecommerce brands in apparel and supplements. Still runs a Shopify store and built Carti to help merchants convert more browsers into buyers.
Ready to boost your store's sales?
Install Carti in 5 minutes and let AI handle customer questions, recommend products, and close sales 24/7.
Start Free Trial14-day free trial