
A mid-sized Shopify apparel merchant can have four credible versions of the same sale before lunch. Meta attributes an order to a prospecting ad, Google assigns it to branded search, an email platform claims the click, and Shopify records one completed transaction. The reports aren't necessarily wrong. They're answering different questions with different identity rules, lookback windows, and definitions of influence.
That's why revenue attribution needs to sit between marketing dashboards and the Shopify order ledger. It helps you understand which touchpoints participated in a purchase, while keeping a clear boundary between credited revenue and revenue the channel caused. For stores that rely on paid media, returning customers, email, and onsite assistance, that distinction determines whether the next budget shift is informed or merely convenient.
Why Revenue Attribution Matters for Shopify Stores
The apparel merchant's weekly report shows $48,000 in Meta-attributed revenue, $31,000 attributed to Google, and $52,000 in net sales in the Shopify orders export. The difference between Meta and Shopify alone is $4,000, while the difference between Meta and Google is $17,000. Nobody can add the platform totals together without counting the same orders more than once.
That gap is what revenue attribution is designed to clarify. Revenue attribution is the practice of assigning credit for a sale to the marketing touchpoints that influenced it, usually by recording the customer journey rather than only the final click. It doesn't rewrite the Shopify order total, and it doesn't prove that every credited interaction caused the purchase. It creates a consistent set of rules for describing influence.
Practical rule: Treat Shopify's transaction record as the revenue ledger. Treat attribution reports as explanations of how that revenue may have been influenced.
Shopify stores have a particularly messy attribution environment. A shopper may click a Meta ad, return through Google branded search, open an email, ask a product question in an onsite chatbot, and complete checkout on another device. The ad platforms may see only their own clicks or modeled events. The chatbot may see an engaged conversation but no ad interaction. Shopify sees the order, customer, discount, fulfillment context, and refund activity, but it won't automatically resolve every marketing touchpoint into one universally accepted story.
That makes CAC, channel comparisons, and onsite ROI vulnerable to inconsistent measurement. A last-click report can make email or direct traffic look dominant because those channels often appear close to checkout. A platform report can make paid media look stronger because the same purchase is eligible for credit in more than one system. Even the broader measurement context matters, so merchants should define revenue metrics alongside their other e-commerce key performance indicators.
A usable framework gives the merchant three practical benefits:
- More defensible budget decisions, because channel credit follows a declared model.
- Cleaner CAC analysis, because attributed spend and order value use compatible rules.
- A way to evaluate chatbot influence, including conversations that assist a sale without receiving the final click.
The objective isn't to find a magical number that every platform accepts. It's to make the disagreement visible, explainable, and useful.
The Main Attribution Models and How They Credit Revenue
Every attribution model is a decision about what “influenced” means. Use the same Shopify journey to see why the answer changes.
Suppose a shopper completes a $120 order after three recorded touches: a Meta ad, a Google branded-search click, and a Carti chatbot interaction. The order is real, but each model distributes its credit differently.
Single-touch models
Last-click attribution assigns the entire $120 to the final eligible touchpoint. If the chatbot interaction was last, the chatbot receives the full amount. If the shopper returned directly after chatting, direct may receive it instead. Last-click is easy to explain and useful for monitoring the immediate conversion path, but it routinely ignores the interactions that created demand earlier.
First-click attribution assigns the full order to the first recorded touchpoint, such as the Meta ad. It answers a narrow acquisition question, namely which source introduced the shopper, but it gives no credit to the search, email, or onsite assistance that helped close the order.
These models are like giving one player the entire score in a team match. The simplicity helps with fast reporting, but the result depends heavily on where the journey starts or ends.
Multi-touch models
Linear attribution divides credit evenly across all eligible touches. With three interactions, the Meta ad, branded search, and chatbot would each receive one-third of the order. It's transparent and avoids declaring one touchpoint the sole winner, although it assumes every interaction mattered equally.
Time-decay attribution gives more weight to interactions near the purchase. A chatbot session immediately before checkout receives more credit than an awareness ad seen earlier. This can reflect late-stage intent, but it can also understate the work that introduced the product.
Position-based, often called U-shaped attribution, emphasizes the first and last touches. A common rule gives 40% to the first touch, 40% to the last touch, and spreads the remaining 20% across middle interactions. On the three-touch journey, that leaves the first and last touchpoints with the larger shares, while the middle touch receives the remainder.
Data-driven attribution uses observed conversion paths to estimate how touchpoints contribute. GA4 uses this approach as its default attribution method, distributing credit across interactions rather than assigning all revenue to one click. The model is more adaptive, but it depends on sufficient conversion data and a clear understanding of the reports being compared. GA4's data-driven model requires at least 400 conversions for the key event and 20,000 total conversions across all events within the lookback window before it activates, as documented in this GA4 attribution report guide.
For stores that need a stronger identity layer, it's also useful to understand the server-side attribution approach for merchants, especially when browser tracking leaves gaps.
| Model | Type | Credit rule | Best for | Limitation |
|---|---|---|---|---|
| Last-click | Single-touch | 100% to final touch | Immediate conversion reporting | Overlooks earlier influence |
| First-click | Single-touch | 100% to first touch | Discovery and acquisition analysis | Ignores closing interactions |
| Linear | Multi-touch | Equal share across touches | Transparent journey reporting | Treats all touches equally |
| Time decay | Multi-touch | More weight near purchase | Late-stage conversion analysis | Undervalues awareness |
| Position-based | Multi-touch | Emphasizes first and last | Journeys with clear entry and exit points | Relies on fixed assumptions |
| Data-driven | Algorithmic | Model-estimated contribution | Stores with substantial path data | Less intuitive and data-dependent |
Pick the model that matches the question. Don't use last-click to judge awareness, and don't use a chatbot's assisted order count as proof of incremental sales without testing it.
Where Industry Attribution Stands in 2026
Attribution is shifting from a last-click habit toward broader measurement. Industry reporting in Ruler Analytics' marketing attribution statistics identifies data-driven attribution as the leading primary model at 38%, while last-click accounts for 24%, down from 47% in 2022. The same report says 64.4% of respondents measure revenue as a marketing KPI, and 84% are confident that marketing affects revenue and sales.
For Shopify merchants, these figures show higher expectations for measurement. They do not establish that GA4 has recovered every influence on an order. GA4 attribution reports define revenue as the amount assigned to a selected dimension, while its default data-driven method distributes credit across touchpoints. GA4 removed first-click, linear, time-decay, and position-based models from its standard interface in November 2023. Merchants who still need those perspectives may require exports or another reporting layer. Google documents the available GA4 attribution models and reports.
The same Shopify orders can therefore produce different channel totals across reports. User Acquisition, Traffic Acquisition, and Advertising reports use different attribution logic and lookback behavior. Branded search may receive credit for capturing demand that already existed. A chatbot conversation may influence a purchase without entering the advertising platform's path.
A Shopify analytics stack needs more than dashboards. Store architecture, event identity, consent handling, and server-side order linking set the boundary for reconciliation. For complex commerce environments, this discussion of technical architecture for Israel marketplaces offers relevant architectural context, even though the attribution principle applies more broadly.
Pair channel credit with incrementality checks. Compare attributed revenue with raw Shopify orders, refunds, server-linked order records, and onsite signals such as chatbot conversations or cart recovery nudges. Use e-commerce analytics tools to compare reports, then standardize one model for budget decisions and document what its revenue credit can and cannot prove.
Tracking Sources and Instrumentation for Shopify
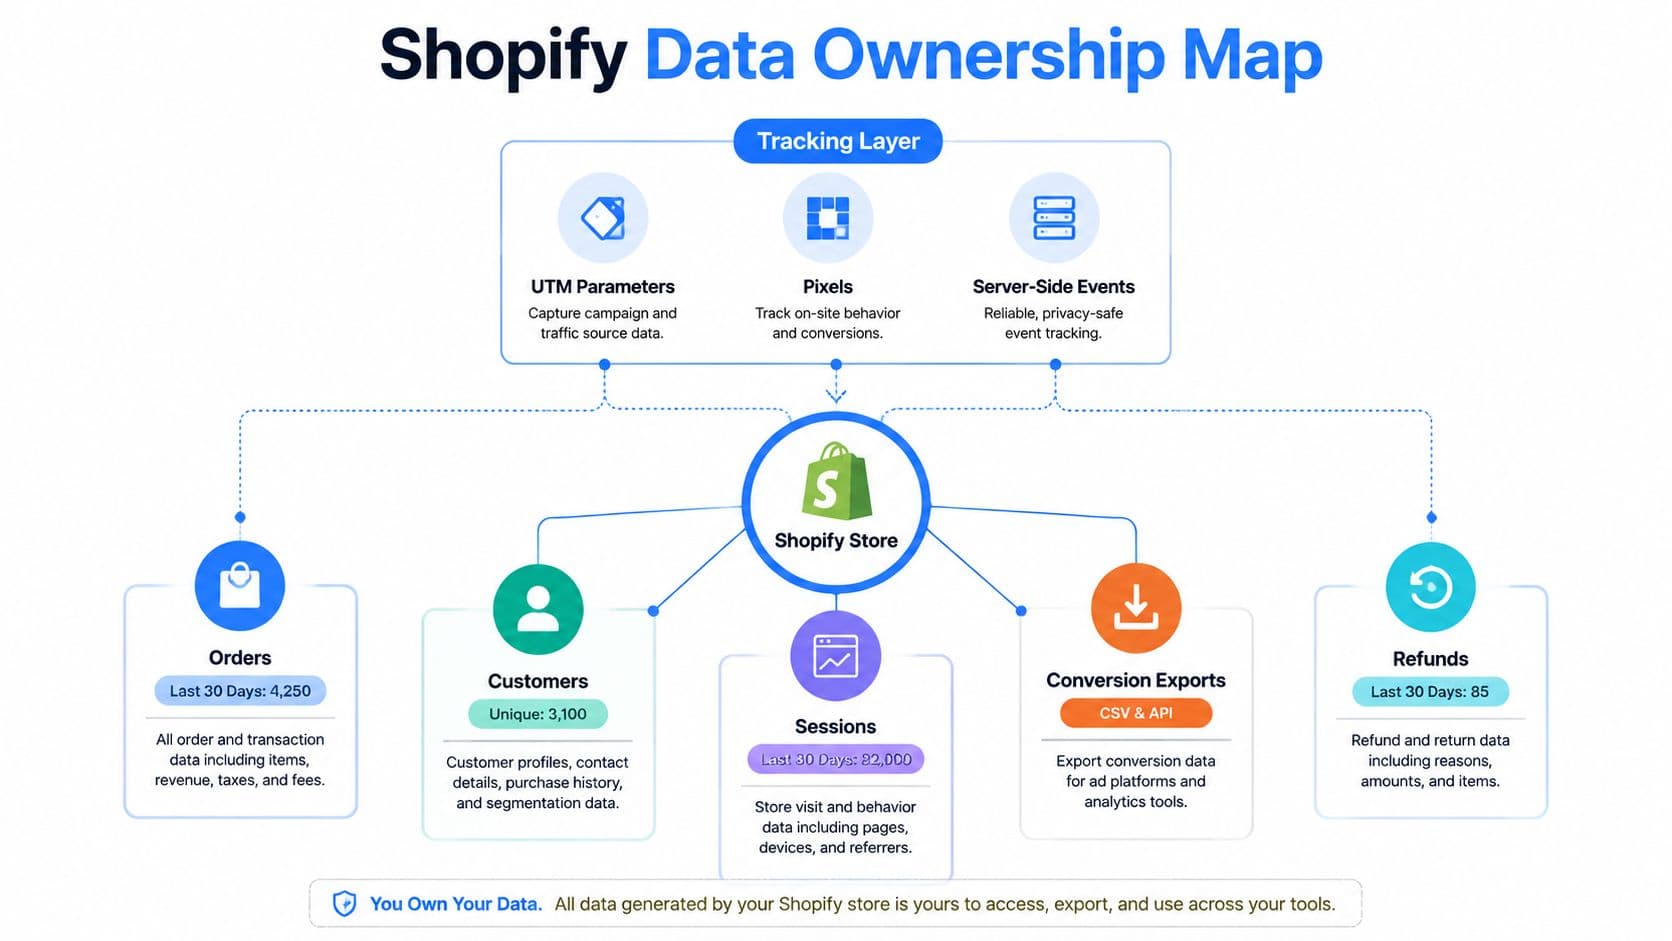
A usable framework gives the merchant three practical benefits: clearer ownership of each record, cleaner joins between marketing and commerce systems, and a revenue view that can be checked against incremental behavior. Shopify owns the order, customer, session-related commerce context, conversion exports, and refund history. Ad platforms own delivery and click logs, GA4 owns event and attribution views, and an onsite assistant owns conversation events. These records can be connected, but they were not collected under identical conditions.
Build a consistent source layer
Start with UTM governance. Give every paid, email, affiliate, influencer, and partner link a predictable source, medium, campaign, and content naming pattern. Keep values lowercase and stable, avoid spaces, and use one spelling for each channel. Missing or inconsistent UTMs break the connection between a marketing click and the Shopify or GA4 session.
Shopify can expose marketing attribution fields and campaign context in its reporting environment. GA4 uses source and medium values to classify sessions and conversions. Report paths vary with Shopify configuration, apps, and analytics implementation, so document which field your team treats as authoritative. This decision matters when Shopify orders and GA4 conversions disagree.
Connect browser and server events
Shopify Customer Events and the Web Pixels API provide the current event layer for storefront activity, replacing older legacy pixel patterns in many implementations. Browser events can capture page views, product interactions, cart actions, and checkout behavior. Consent settings and browser restrictions can still leave gaps.
Server-side events through a Conversion API can send order and conversion information from the backend or commerce system. Use an event ID, transaction ID, or order ID to deduplicate server and browser signals. Without a shared identifier, both layers may report the same purchase and cause a channel to count one order twice.
A practical instrumentation checklist includes:
- Tag every campaign link: Preserve UTMs through redirects and landing-page navigation.
- Pass a transaction identifier: Send the Shopify order ID as the transaction ID wherever the destination system supports it.
- Persist identity carefully: Use consented email or phone identifiers, or a stable session and user identifier, to connect cross-device behavior.
- Capture click identifiers: Store ad click IDs alongside the session or customer record when consent allows.
- Log onsite events: Record chat opened, product question, recommendation, cart recovery, and checkout interactions with timestamps.
The final join should be explicit. A Shopify order ID connects the customer and transaction value. The session connects UTM and click identifiers, while the onsite event connects to the session or cart token. Refund records then adjust the revenue view, preventing a returned order from remaining permanent value.
Use these joins alongside incrementality checks. Compare credited revenue with raw Shopify orders, refunds, server-linked records, and onsite signals such as chatbot conversations or cart recovery nudges. Attribution shows where credit was assigned. These checks help determine whether the interaction had measurable influence.
Data principle: If an interaction can't be joined to a session, cart, customer, or order, report it as an observed event, not as attributable revenue.
Calculating Attributable Revenue With Real Examples
The basic calculation is straightforward:
Attributed revenue = sum of touchpoint credit weight × conversion value.
The difficult part is choosing and documenting the credit weight. Consider a four-touch journey ending in a $240 order: a paid social impression, a Google search click, an email open, and a direct return.
| Model | Paid Social | Google Search | Direct | |
|---|---|---|---|---|
| Last-click | $0 | $0 | $0 | $240 |
| First-click | $240 | $0 | $0 | $0 |
| Linear | $60 | $60 | $60 | $60 |
| Time decay | $96 | $60 | $48 | $36 |
| Position-based | $96 | $48 | $48 | $48 |
The time-decay row uses the requested 40/25/20/15 weighting. Position-based uses 40/20/20/20, giving the first touch the strongest share and distributing the remainder across the other interactions. Those are declared rules, not observed causal effects.
Assisted conversions need a separate label
An assisted conversion is an order where a channel appeared in the journey but did not receive the final-touch credit. GA4-style conversion paths can expose these interactions, while Shopify remains the place to reconcile the order amount and any later refund. Don't add assisted revenue to last-click revenue as though both are incremental sales. Assisted status describes participation in a path.
A useful report can show:
- Last-click revenue, based on the selected final-touch rule.
- Assisted orders, where the channel appeared earlier.
- Model-attributed revenue, using the declared multi-touch rule.
- Raw Shopify net revenue, after applying the store's transaction and refund logic.
Check for over-crediting before changing spend
An over-crediting signal appears when the total revenue a channel claims in its own dashboard exceeds the conversions or transaction value that the store can reconcile to that channel and period. First check date ranges, timezone, currency, refunds, duplicate browser and server events, and whether several platforms are claiming the same order.
For causal decisions, use a simple lift calculation:
Incremental lift = (campaign-period revenue − baseline revenue) / baseline revenue.
That calculation becomes meaningful only when the baseline is comparable and the campaign exposure is tested against an appropriate control. Attribution can show where the order appeared to travel. It can't establish that the order wouldn't have happened without the touchpoint.
Measuring Chatbot and Onsite Engagement Impact
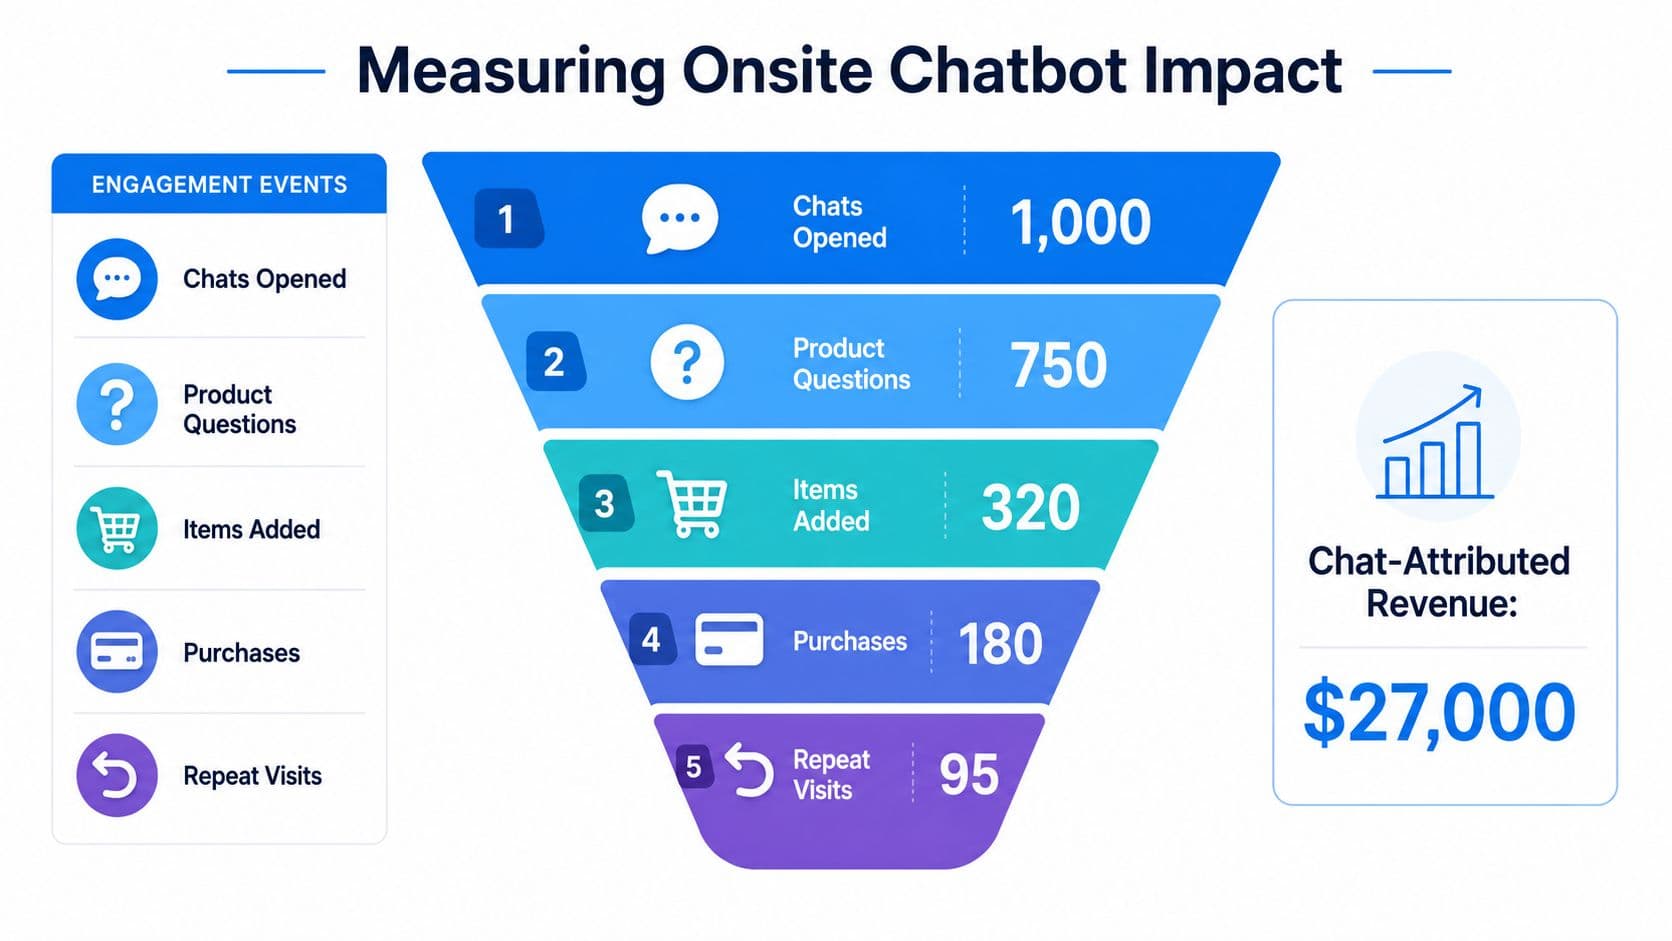
Onsite engagement deserves its own measurement layer because a chatbot can influence a purchase without generating the ad click or the final checkout session. The safe approach is to record the interaction first, join it to the commerce record second, and assign revenue only when the link is present.
Track events that represent distinct shopper behavior:
- Chat opened, which shows initial engagement.
- Product question asked, which signals information seeking.
- Discount offered, which records a commercial intervention.
- Cart recovered, which identifies a recovery action.
- Order completed, which connects the journey to transaction value.
Each event should carry a session ID, timestamp, and, where available, cart token. When checkout completes, pass the Shopify order ID into the event payload or maintain a server-side join between the cart and order. That lets you distinguish a shopper who merely opened chat from one whose conversation preceded a completed purchase.
Separate recovery from influence
Cart recovery rate is:
Recovered carts ÷ abandoned carts.
Recovered revenue is the net value of orders linked to those recovered carts, subject to your refund policy. Neither metric proves incremental impact on its own. Some shoppers would have returned and purchased without the reminder.
Use a holdout when you need causal evidence. Keep a comparable group from receiving the recovery nudge, then compare purchase behavior between exposed and held-out shoppers. The difference is the evidence of lift, while the attributed order list tells you which sessions and orders were involved.
The Insights Dashboard can also surface assisted conversions. These are chatbot-influenced orders where the shopper may not have started the session through the chatbot or may have completed through another channel. A useful operational formula is:
assisted_conversions = total_influenced_orders − last_click_chatbot_orders
Suppose the dashboard shows $12,000 in last-click chatbot revenue and an assisted multiplier of 1.8×. If that multiplier is defined as total influenced revenue divided by last-click chatbot revenue, total influenced revenue is $21,600, and the assisted portion is $9,600. If the dashboard instead defines the multiplier on order count, don't apply it to revenue. Confirm the metric definition before using the arithmetic.
For a practical overview of event-level reporting, see chatbot analytics for Shopify.
A chatbot report should therefore show direct orders, assisted orders, recovered carts, linked revenue, refunds, and tested lift separately. Combining them into one “chatbot revenue” number makes the tool look more influential, but it makes budget decisions less reliable.
Dashboards, Metrics, and Common Pitfalls
A weekly attribution review should answer four questions without forcing the team to reconcile spreadsheets during the meeting.
First, compare channel mix by model, placing last-click beside the chosen multi-touch view. Second, inspect assisted-conversion depth, including how often each channel appears before checkout. Third, isolate chatbot conversation-to-order paths. Fourth, reconcile the result with raw Shopify revenue, orders, and refunds.
The core metrics are:
- Attributed revenue per channel, under one declared model.
- Model divergence, the difference between two model outputs.
- Assisted-to-last-click ratio, separated by channel.
- Cart recovery conversion rate, tied to a defined abandoned-cart population.
- Experiment-tested lift, when a holdout or geo test exists.
A useful reporting framework also benefits from the measurement principles in SelfServe's revenue analytics strategies, particularly the need to connect operational data with decisions rather than treating dashboards as the final product.
Read symptoms before changing campaigns
| Pitfall | Symptom in reports | Fix |
|---|---|---|
| Last-click overcredits conversion channels | Email, direct, or retargeting dominates the final-touch view | Compare with first-touch and multi-touch paths |
| Awareness touches disappear | Video or prospecting activity has impressions but little conversion credit | Use path analysis and test exposed versus held-out groups |
| Privacy-related signal loss | Direct or unattributed traffic rises while platform totals fall | Improve consented first-party and server-side event coverage |
| UTM sprawl | Similar email campaigns appear under several sources or mediums | Lock naming conventions and normalize historical values |
| Chat sessions fail to join orders | Conversations appear in engagement reports but not revenue reports | Persist the session or cart token and pass the order ID |
| Refunds remain in attributed totals | Channel revenue exceeds the net order ledger | Join refund events and report gross and net views separately |
Attribution describes correlation between observed touchpoints and orders. Incrementality experiments are the mechanism for testing causation, especially before a major budget reallocation. Use attribution for in-channel optimization, then use controlled evidence to decide whether a channel deserves more total investment.
Your Revenue Attribution Implementation Plan
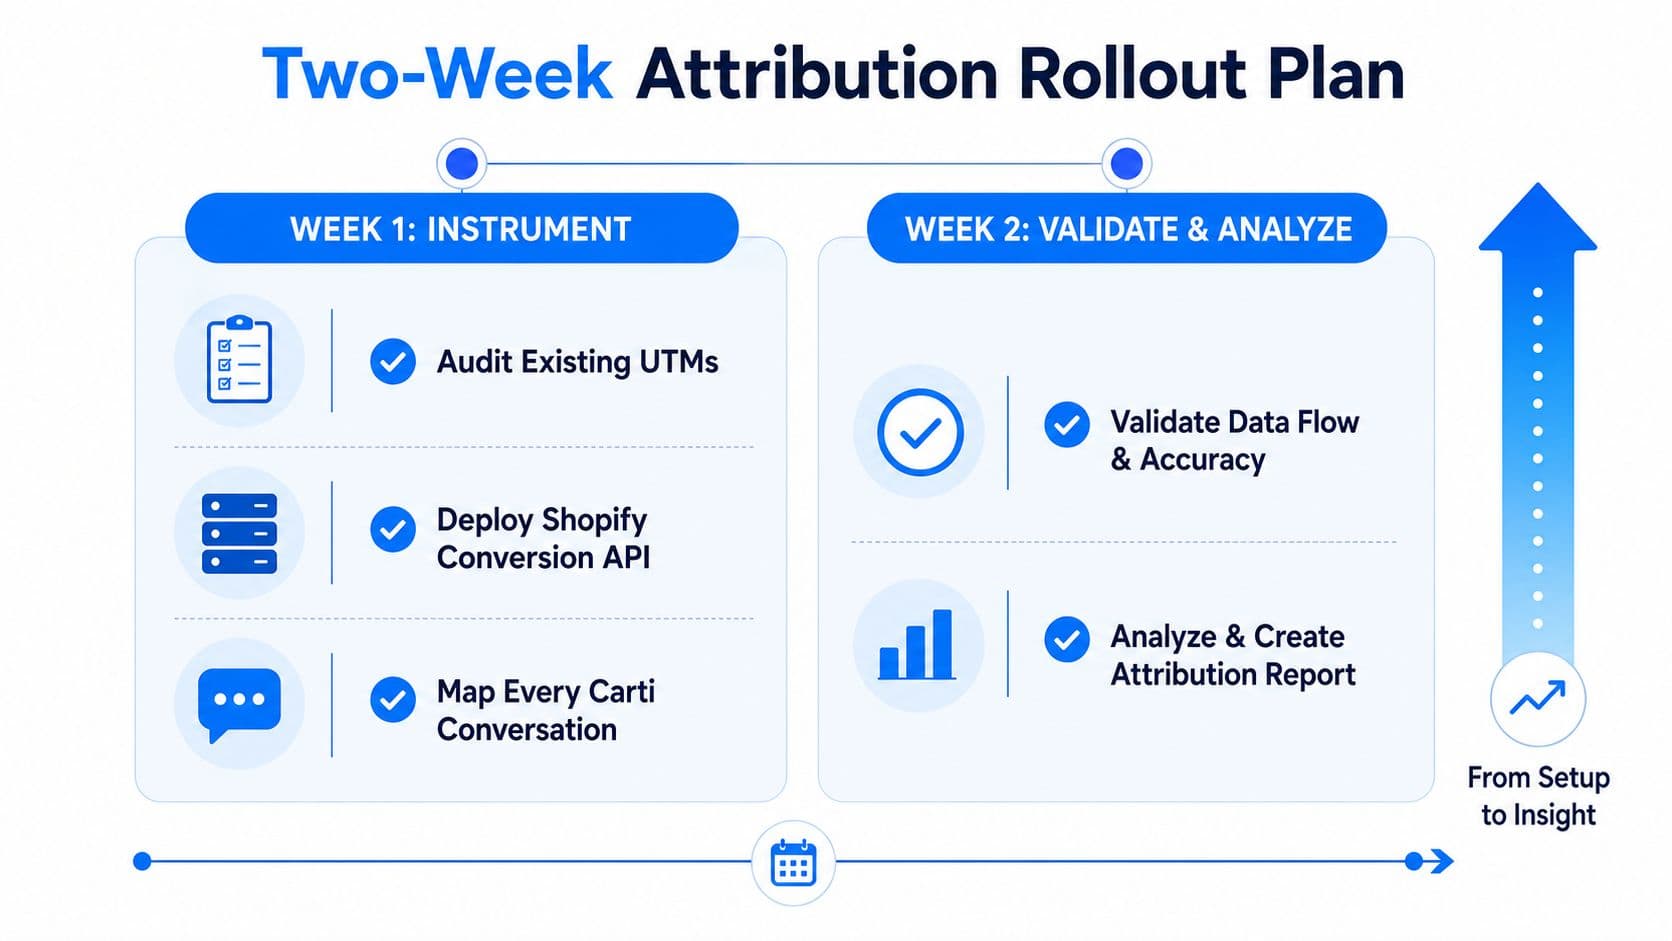
A practical rollout can move from fragmented reports to a working measurement system in two weeks, provided the store starts with its largest sources and keeps the first model understandable.
Week one focuses on instrumentation
Audit existing UTMs across Meta, Google, email, affiliates, organic campaigns, and partner links. Standardize source, medium, campaign, and content values before adding more tracking fields. Deploy Shopify server-side conversion events, configure browser and server deduplication, and map every Carti conversation to the cart token or order ID used at checkout.
Also document the identity chain:
- Campaign link to UTM and click ID.
- Click or session to consented user identifier.
- Session to cart token.
- Cart token to Shopify order ID.
- Order ID to net revenue and refund records.
Week two validates and tests
Reconcile GA4-attributed revenue with raw Shopify orders and refund logs. The rollout target in this plan is under 2% unexplained variance, but treat that as an internal acceptance criterion, not a universal industry benchmark. Investigate discrepancies before changing campaign budgets.
Run a holdout experiment on the highest-spend channel or the most consequential recovery flow. Compare last-click credited revenue with the difference in outcomes between exposed and held-out groups. Then launch the chosen multi-touch view for decision-making while keeping last-click visible so stakeholders can understand the transition.
Before declaring the system ready, confirm:
- UTM hygiene: Every active campaign follows the same naming convention.
- Server-side coverage: Conversion events reach the destination system with deduplication keys.
- Consent controls: Measurement respects the store's consent and privacy configuration.
- Order linking: Cart, session, chatbot, and order identifiers join reliably.
- Model selection: The team has documented which model drives budget decisions.
- Reconciliation: Gross sales, net sales, refunds, and attributed totals have separate definitions.
- Stakeholder sign-off: Marketing, analytics, finance, and customer experience agree on how reports should be read.
Carti connects Shopify chatbot conversations, product questions, cart recovery activity, and linked orders so merchants can separate direct influence from assisted engagement in their revenue attribution workflow. Visit Carti to evaluate its onsite sales assistance and Insights Dashboard alongside your existing Shopify and GA4 measurement stack.

Written by
Daniel AndersonFounder of Carti. 10+ years building ecommerce brands in apparel and supplements. Still runs a Shopify store and built Carti to help merchants convert more browsers into buyers.
Ready to boost your store's sales?
Install Carti in 5 minutes and let AI handle customer questions, recommend products, and close sales 24/7.
Start Free Trial14-day free trial