
You're probably looking at Shopify analytics right now and seeing a familiar mix of numbers. Sessions are up. A few products get plenty of pageviews. Revenue moves around week to week. Conversion feels stuck. Support inbox volume changes, but it's hard to tell whether that's good or bad. Nothing in the dashboard clearly tells you where shoppers are getting excited, where they're getting confused, or what to fix first.
That's the gap customer engagement metrics fill.
Good operators don't just track outcomes. They track the interactions that create those outcomes. If revenue is the scoreboard, engagement shows the plays that led there. For a Shopify store, that means separating vanity activity from signals that point to more conversions, stronger retention, and fewer leaks in the journey.
Why Most Shopify Analytics Are Misleading
Most Shopify stores don't have a data problem. They have a prioritization problem.
The default dashboard pushes you toward top-line numbers like sessions, total sales, and average order value. Those matter, but they're outcome metrics. They tell you what happened after the fact. They rarely tell you why it happened or what to do next.
That's where many new operators get stuck. Traffic rises, but conversion doesn't. Orders dip, and the first reaction is to blame ads. Support tickets increase, so it feels like something is broken. Then a week later, sales bounce back and no one knows what changed.
Practical rule: If a metric doesn't help you decide what action to take this week, it's not a useful operating metric.
Customer engagement metrics matter because they connect interaction quality to commercial outcomes. Modern CX guidance consistently groups NPS, CSAT, customer retention rate, churn rate, conversion rate, average session duration, and pages per session as core measures, which shows that engagement is tracked through both sentiment and behavior, not one score alone, as outlined by TELUS Digital's customer engagement metrics guide.
A lot of store owners still manage the business like this:
- Traffic is up: so marketing must be working
- Revenue is flat: so conversion must be the issue
- Support volume is high: so customer service must be under pressure
That logic is too blunt. Traffic can rise because you bought low-intent visits. Revenue can stay flat because product pages don't answer key questions. Support volume can go up because more shoppers are closer to purchase and need reassurance.
What works is narrower. Pick a small set of customer engagement metrics that expose friction at the product page, cart, checkout, and post-purchase stages. Then review them consistently enough to spot patterns before they show up in revenue.
What Are Customer Engagement Metrics Anyway
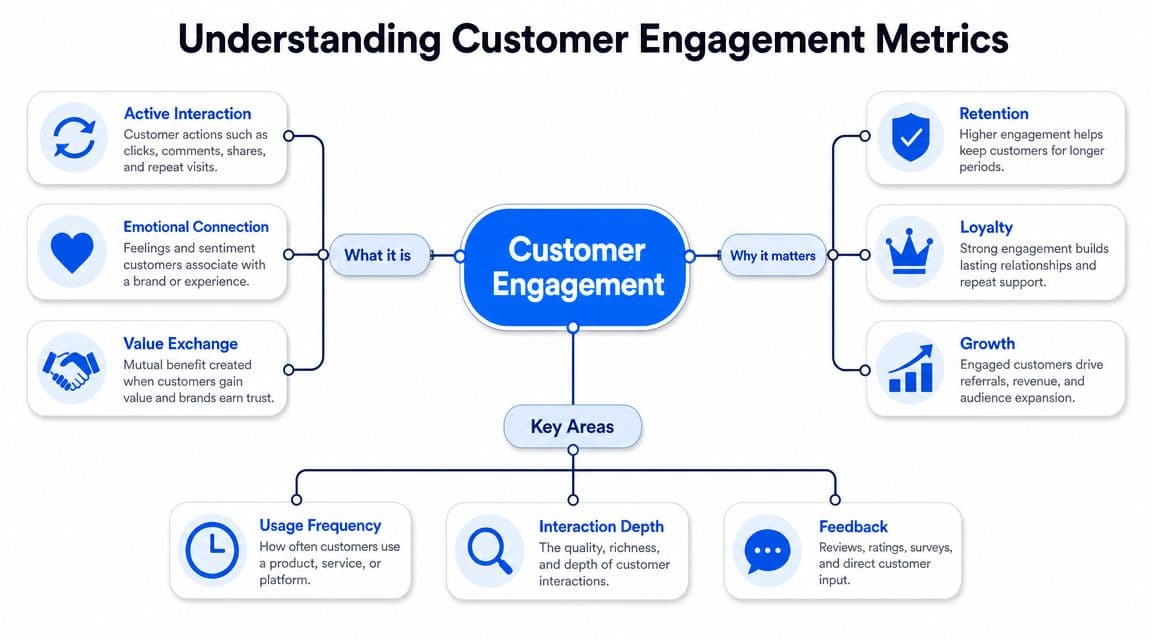
Customer engagement metrics measure how people interact with your store, your brand, and your support experience over time. They help you distinguish between a visitor who glanced at a page and left, and a shopper who explored products, asked questions, added to cart, bought, and came back.
A simple way to think about it is physical retail. If someone walks into a store, lingers at a display, asks a sales associate a question, tries a product, and returns next week, you'd call that engaged behavior. E-commerce is the same. The only difference is that the signals are digital.
Think like a store owner, not a dashboard owner
A useful definition is this. Customer engagement metrics track the depth, quality, and business value of shopper interactions.
That includes signals like:
- Behavioral actions: pages per session, average session duration, feature use, live chat use, clicks
- Sentiment signals: CSAT and NPS
- Outcome measures: conversion rate, retention rate, churn rate
That mix matters. If you only track behavior, you might miss frustration. If you only track survey scores, you might miss whether people are buying or returning.
A store with lots of clicks and weak retention doesn't have engagement. It has activity.
Three buckets that make the data useful
I like to sort customer engagement metrics into three buckets.
Behavioral metrics
These tell you what shoppers did. They're useful early because behavior shows friction fast. Long sessions can mean interest, but they can also mean confusion. More pages per session can mean discovery, or it can mean people can't find what they need.
Sentiment metrics
These tell you how customers felt. CSAT and NPS belong here. They matter most after support interactions, delivery experiences, and repeat purchase moments when customers can tell you whether the brand is meeting expectations.
Business outcome metrics
These tell you whether engagement is turning into durable business health. Customer retention rate is the percentage of existing customers who remain with a business over a period of time, while churn rate is the percentage of customers who stop doing business over a specified period. Those definitions are central to how teams operationalize engagement, and Gainsight's guidance cited in the earlier source recommends focusing on only 3 to 5 core metrics tied to the main business problem.
That last point is important. You don't need a giant scorecard. You need a short list that helps you act.
Prioritizing Metrics for Your Shopify Store
If you track everything, you'll improve nothing.
Meaningful measurement requires a mix of behavioral, sentiment, outcome, and channel-specific metrics with clear goals. For Shopify merchants, that matters because email opens, onsite clicks, and support tickets can all move independently without showing whether engagement is improving conversions or reducing friction, as explained in Twilio's guide to measuring customer engagement.
For most DTC brands, the cleanest framework is leading indicators versus lagging indicators.
Leading indicators tell you what to work on
Leading indicators are the metrics you can influence directly through site changes, messaging, support, merchandising, and automation. They usually move before revenue does.
For a Shopify store, I'd start with these:
-
Conversion rate
This is still a business outcome, but operationally it acts like a bridge metric. It tells you whether product pages, offers, and checkout are doing their job. -
Average session duration
Useful for understanding whether shoppers are engaging with your content and product detail pages. -
Pages per session
Good for gauging navigation quality and product discovery depth. -
CSAT by channel Support quality often affects whether someone buys again, requests help, or stops engaging.
-
Channel-specific engagement
Email clicks, live chat usage, or product discovery interactions matter when they tie back to purchase intent.
If you sell across multiple channels, the same prioritization logic applies elsewhere. For example, this breakdown of HiveHQ insights for TikTok Shop sellers is useful because it pushes past surface activity and focuses on the metrics that show sales momentum.
Lagging indicators tell you if the business is getting healthier
Lagging indicators validate whether your leading metrics are improving the business over time.
The key ones are:
- Customer retention rate
- Churn rate
- NPS
- Revenue from returning customers
These are slower-moving. They matter a lot, but they're poor day-to-day steering metrics. You don't fix retention directly. You improve the interactions that drive retention.
A lot of merchants also need a better KPI map overall. If your reporting still mixes operational and financial numbers into one flat list, this guide to e-commerce key performance indicators is a useful companion.
Key Engagement Metrics for Shopify Stores
| Metric | Type | How to Calculate | Why It Matters |
|---|---|---|---|
| Conversion rate | Leading | Conversions ÷ visitors or sessions | Shows whether traffic and product experience are producing purchases |
| Average session duration | Leading | Total session duration ÷ total sessions | Helps identify whether visitors are spending meaningful time engaging |
| Pages per session | Leading | Total pageviews ÷ total sessions | Reveals browsing depth and navigation quality |
| CSAT | Leading | Positive responses ÷ total responses | Shows whether support or service interactions meet expectations |
| Customer retention rate | Lagging | Existing customers retained over a period as a percentage | Indicates whether buyers keep coming back |
| Churn rate | Lagging | Customers lost over a period as a percentage | Exposes how many customers stop buying |
| NPS | Lagging | Promoters minus detractors from survey responses | Signals loyalty and likelihood to recommend |
The practical takeaway is simple. Start with 3 to 5 core metrics. Use leading indicators to decide what to fix. Use lagging indicators to confirm whether those fixes are creating a healthier business.
Calculating and Tracking Your Engagement Metrics
A new Shopify store owner usually hits the same wall around month two or three. The dashboards are full, the traffic graph looks active, and there is still no clear answer to a simple question: which signals show buying intent now, and which ones only confirm the result later?
That is the job of tracking. Build a setup that separates leading indicators from lagging ones and ties each metric to one owner, one data source, and one action. If a metric cannot help you decide what to fix, it does not belong on the weekly view.
Use the tools you already have first. Shopify Analytics covers purchase behavior and returning customer trends. Google Analytics covers onsite behavior. Your help desk or survey tool covers service sentiment. Add another platform only when it gives you a missing view, such as chat-assisted purchases or product-level hesitation patterns.
Start with a simple tracking stack
For most Shopify brands, a practical stack looks like this:
- Shopify Analytics: orders, returning customer behavior, conversion summaries
- Google Analytics: session behavior, page paths, landing page engagement
- Email platform: opens, clicks, and revenue by campaign
- Support platform or survey tool: CSAT, resolution time, and ticket themes
That gives you enough coverage to answer the questions that matter. Are shoppers engaging with the store? Are they getting stuck before purchase? Are existing customers coming back?
Keep channel metrics in context. Email opens and clicks can point to message-market fit, but they are weak indicators on their own. Review them alongside product page engagement, add-to-cart rate, checkout starts, and repeat purchase behavior.
Core formulas you should know
Consistency beats complexity here. Use the same formulas every week and avoid switching definitions mid-quarter.
-
Conversion rate
Conversions ÷ visitors or sessions -
Pages per session
Total pageviews ÷ total sessions -
Average session duration
Total duration of all sessions ÷ total number of sessions -
Customer retention rate
Customers retained during a period ÷ customers at the start of that period -
Churn rate
Customers lost during a period ÷ customers at the start of that period -
CSAT
Positive survey responses ÷ total responses
Support metrics get messy fast if teams send surveys at random points in the journey. If you need a cleaner framework, review this guide on what a CSAT score is before you lock your reporting process.
Track leading indicators weekly. Review lagging indicators monthly. That cadence works well for most DTC teams because it gives you enough speed to catch friction early without overreacting to noisy daily swings.
Turn raw numbers into decisions
The calculation is the easy part. The hard part is reading the pattern correctly.
If average session duration rises on product pages and conversion stays flat, interest is there but confidence is missing. Shoppers may need better size guidance, delivery clarity, reviews, or faster answers to objections. If email clicks go up and onsite conversion does not, the campaign did its job but the landing experience did not. If CSAT is healthy and retention is weak, support may be solving problems after the customer has already had a poor buying experience.
This is also where automation becomes useful. An AI chatbot can answer product questions, recommend the right item, recover carts, and log the objections shoppers raise most often. That gives you two benefits at once: stronger engagement in the moment and better diagnostic data for the team.
For retention, keep a separate view for first-time buyers versus repeat buyers. They behave differently and need different interventions. Brands working on post-purchase engagement can borrow from these strategies to boost customer loyalty and then measure whether those changes improve repeat purchase rate, churn, and support volume over time.
Native dashboards often miss interaction-level metrics that matter in DTC. Examples include proactive chat engagement rate, chat-assisted conversion rate, and cart recovery from support conversations. Those metrics matter when they connect to revenue or retention, not when they sit in a slide deck with no owner.
Here's a walkthrough that helps frame how modern onsite assistance fits into that measurement model:
How to Improve Your Key Engagement Metrics
A new Shopify store owner often sees this pattern in the first few months. Traffic starts climbing, ad spend goes up, sessions look healthy, and sales still feel stuck. The problem usually sits lower in the funnel. Shoppers are landing, hesitating, and leaving with unanswered questions.

The fix is usually operational, not promotional. Product pages, cart, checkout, and post-purchase moments drive more engagement gains than another campaign launch. I would treat those four areas as your first pass before spending more to acquire traffic.
Chat is a good example. As noted earlier, shoppers who use live chat tend to convert at a higher rate. The reason is straightforward. Good chat shortens the decision cycle by answering objections while intent is still high.
Improve the metric that sits closest to the leak
A flat list of engagement metrics is not enough. Shopify and DTC brands need a priority model. Start with leading indicators that show friction early, then move to lagging indicators that confirm whether the fixes changed revenue or retention.
Use this operating approach:
-
If pages per session are weak
Start with discovery. Clean up collection page structure, tighten filters, add stronger product recommendations, and make sure each page gives shoppers an obvious next click. If visitors browse one page and stop, they are not curious enough yet or the path forward is unclear.
-
If average session duration is low on product pages
Audit the page for missing buying information. Put shipping timing, returns, sizing, compatibility, materials, and care instructions higher on the page. For many stores, an AI assistant can answer those questions instantly and reduce the need for shoppers to hunt through tabs or FAQs.
-
If conversion rate is soft but product engagement looks decent
Check trust and checkout friction. Reviews, delivery estimates, return clarity, mobile speed, payment options, and cart distractions all matter here. This is a lagging indicator, so avoid treating conversion rate as the first diagnosis. Use it to confirm whether upstream fixes worked.
-
If CSAT varies by channel or time of day
Standardize the response itself, not just the response time. A fast but incomplete answer creates repeat contacts and lowers confidence. Use saved replies carefully, then review transcripts to see where agents or automations are missing the true question.
-
If repeat purchase rate is slipping
Look at what happens after the order, not just before it. Replenishment reminders, onboarding, delivery updates, care guidance, and returns handling all shape whether a first order becomes a second. For a practical retention playbook, review these strategies to boost customer loyalty.
The trade-off is simple. Teams that chase every metric at once spread effort too thin. Teams that pair one metric with one owner and one intervention usually improve faster.
Automation helps when it removes friction at the exact moment a shopper stalls. It does not help when it adds noise. A useful AI chatbot can answer pre-purchase questions, recommend the right product, recover carts, and tag common objections for the team to review later. That gives you immediate conversion support and cleaner insight into what is blocking buyers.
I also like connecting engagement work to a broader customer health scoring model for ecommerce brands. It helps teams separate one-off activity from patterns that predict repeat purchase, churn risk, or rising support demand.
Keep the execution simple:
-
Pick one leading indicator to improve first
Examples include product-page engagement, cart starts, or chat engagement rate. -
Assign one concrete fix
Rewrite PDP copy, add a sizing assistant, trigger cart help, or clean up mobile checkout. -
Set a short review window
Seven to fourteen days is usually enough to see directional change on a focused test. -
Validate with a lagging metric
Check whether conversion rate, repeat purchase rate, or support volume moved in the right direction.
That is how engagement metrics become useful. They stop being dashboard decoration and start guiding actions that raise revenue and retention.
Building an Engagement Report That Informs Strategy
A good engagement report shouldn't just summarize metrics. It should tell you where the business is leaking and which team should act.
Aggregate reporting hides too much. A store can show healthy top-line engagement while losing mobile shoppers, paid-traffic visitors, or first-time browsers at a specific step. In other words, aggregate metrics can hide profitable micro-segment failures, especially now that AI chat creates new micro-interactions standard dashboards often miss, as noted in Crazy Egg's guide to customer engagement metrics.
Segment before you conclude anything
Every weekly or monthly report should split performance at least three ways:
-
By device
Mobile and desktop rarely behave the same. Product discovery, cart behavior, and checkout friction often differ sharply. -
By traffic source
Paid, organic, email, and direct traffic arrive with different intent levels. Don't average them together and call it insight. -
By customer type
New versus returning customers should never be lumped into one engagement story.
A simple reporting view might include:
| Segment | Leading metric to watch | Question to ask |
|---|---|---|
| Mobile visitors | Conversion rate, pages per session | Are shoppers struggling to browse or buy on smaller screens? |
| Paid traffic | Session quality, conversion rate | Does ad promise match landing page reality? |
| Returning customers | Retention trend, CSAT | Are we making repeat purchase easier or harder? |
| First-time visitors | Session duration, product page engagement | Are we building confidence fast enough? |
Add qualitative signals to the report
The strongest reports combine numbers with actual customer questions.
If shoppers keep asking about sizing, ingredient details, delivery timing, shade matching, or return windows, that isn't just support data. It's merchandising and conversion data. Those questions should influence product page copy, FAQ placement, email messaging, and ad creative.
For teams building a more mature retention program, this guide to customer health scoring is helpful because it connects engagement patterns to customer risk and opportunity in a more strategic way.
The rule is simple. Every report should end with decisions, not observations.
From Metrics to Momentum
Most Shopify brands don't need more dashboards. They need a better operating loop.
Start with a short list of customer engagement metrics. Separate leading indicators from lagging ones. Track them on a steady cadence. Tie each metric to one action. Then review the results by segment so you can spot the friction that aggregate reporting hides.
That's when analytics starts becoming useful. Not because the graphs look cleaner, but because the team knows what to do next.
The stores that grow steadily usually follow the same rhythm. They prioritize the right metrics, track them consistently, improve the weak points, and learn from the patterns. Then they repeat. Over time, that creates compound gains in conversion, customer experience, and retention.
Customer engagement metrics aren't a reporting exercise. They're a management system for how your store earns the next sale and the next repeat purchase.
If you want a faster way to turn shopper questions into conversions, Carti helps Shopify stores answer instantly, guide product discovery, recover carts, and surface the questions that reveal where your store is losing buyers. It works like a 24/7 sales associate, which makes it easier to move from measuring engagement to improving it every day.

Written by
Daniel AndersonFounder of Carti. 10+ years building ecommerce brands in apparel and supplements. Still runs a Shopify store and built Carti to help merchants convert more browsers into buyers.
Ready to boost your store's sales?
Install Carti in 5 minutes and let AI handle customer questions, recommend products, and close sales 24/7.
Start Free Trial14-day free trial