Most Shopify stores don't have a traffic problem. They have a leakage problem.
The useful shift is to stop staring at overall conversion rate and start tracking where shoppers disappear. In funnel analysis, drop off rate means the share of users who enter a defined step and never make it to the next one. A simple example makes it concrete: if 1,000 users start a sign-up flow and 700 finish, 300 drop off, which means a 30% drop-off rate, as explained in CleverTap's breakdown of user drop-off rate. That framing turns “people aren't buying” into a solvable operational problem.
For Shopify merchants, that matters because revenue rarely leaks everywhere at once. It usually leaks at one ugly junction: product page to cart, cart to checkout, shipping step to payment, or the final review screen where total cost lands harder than expected. When you measure step by step, you stop guessing and start fixing the exact point where intent collapses.
Table of Contents
- Why Most of Your Store Visitors Never Buy
- What Is Drop-Off Rate and How to Calculate It
- Ecommerce Funnel Drop-Off Rate Benchmarks
- Diagnosing the Common Causes of High Drop-Off
- Prioritized Tactics to Reduce Your Drop-Off Rate
- How Carti Turns Drop-Offs into Conversions
- Frequently Asked Questions About Drop-Off Rate
Why Most of Your Store Visitors Never Buy
Most visitors were never going to buy on their first session. That's normal. The mistake is treating every non-purchase as random when many of them are tied to a specific break in the buying journey.
Store owners often focus on a single top-line metric and ask, “How do I improve conversion rate?” That question is too broad to be useful. A better question is, “Where are shoppers losing momentum?” That's why drop off rate is more practical than a sitewide average. It points to a stage, a screen, or an action where intent weakens.
A healthy optimization process usually starts with a funnel view, not a homepage redesign. If your product page gets attention but cart adds stay weak, you likely have an offer, trust, or merchandising issue. If carts fill up and checkout starts but orders stall, the problem is probably cost shock, form friction, or payment confidence.
Practical rule: Diagnose the step before you redesign the site. Broad redesigns often hide the real problem instead of fixing it.
For Shopify merchants, profit leaks become apparent. You already paid for the click through Meta, Google, email, influencer traffic, or organic search. When a shopper leaves mid-funnel, the lost opportunity isn't abstract. It's a buyer who showed intent and got stuck.
That's also why conversion work should be tied to funnel stages, not vague “improvements.” If you want a deeper foundation on the bigger discipline behind this, conversion optimization for ecommerce stores is the broader frame. Drop off rate is one of the sharpest tools inside that process because it tells you where to look first.
What the metric changes in practice
Once you view the store through drop-offs, your priorities get simpler:
- Product-page leaks usually point to weak positioning, thin product content, poor image hierarchy, or unresolved objections.
- Cart-stage leaks often expose unexpected costs, unclear delivery expectations, or second thoughts about value.
- Checkout leaks tend to reveal friction. Too many fields, weak mobile UX, limited payment options, or trust concerns.
That's a more useful roadmap than “traffic is up but sales feel soft.” It gives you a shortlist, not a mystery.
What Is Drop-Off Rate and How to Calculate It
Drop-off rate measures how many shoppers enter a funnel step and fail to reach the next one. For a Shopify store, that matters because revenue rarely disappears evenly across the site. It usually leaks at a specific transition, such as product page to cart, cart to checkout, or checkout to purchase.
That makes drop-off rate a diagnostic metric, not just a definition.
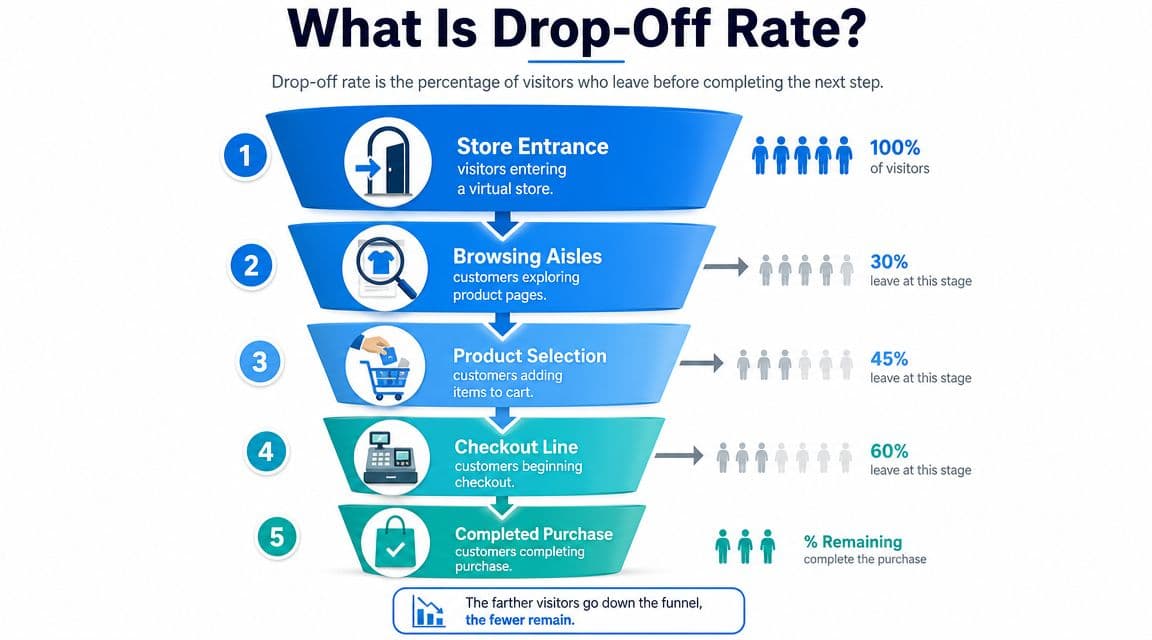
A simple way to read it is this: if 1,000 people hit a step and 700 continue, 300 dropped. The drop-off rate for that step is 30%.
Formula: (users who entered the step − users who continued) ÷ users who entered × 100
The key is step definition. “All visitors” is too broad to fix. “Viewed cart but did not begin checkout” gives you something you can investigate and improve.
The formula in a Shopify funnel
For most ecommerce stores, the useful transitions are:
- Product page to add to cart
- Cart to begin checkout
- Checkout start to payment step
- Payment step to purchase
Here is a straightforward Shopify example. If 500 shoppers add a product to cart and 200 begin checkout, 300 did not continue. The cart-step drop-off rate is 60%.
That number does not tell you why people left. It tells you where to start looking. In practice, that saves time. Store owners often redesign PDPs when the underlying issue is shipping sticker shock in cart, or they blame checkout when paid traffic is landing on weak product pages.
How to calculate it without overcomplicating reporting
Use the same method at every stage:
- Count how many users entered the step
- Count how many reached the next step
- Subtract the second number from the first
- Divide by the number who entered
- Multiply by 100
Consistency matters more than fancy reporting. If your event setup changes every month, trend lines become hard to trust and harder to act on.
For Shopify merchants, the practical goal is not perfect analytics purity. The goal is to identify the highest-value leak fast enough to fix it.
How to find it in GA4
In Google Analytics 4, use Explore > Funnel exploration. Build the journey using your actual ecommerce events or page paths. A common setup looks like this:
- View item
- Add to cart
- Begin checkout
- Add payment info or payment-related page view
- Purchase
Then break the funnel down by device, traffic source, landing page, and country if you sell across markets. A 45% checkout drop on desktop branded traffic is a different problem from a 45% checkout drop on mobile paid social.
This is also where modern support tools help. If shoppers keep stalling at cart or checkout, AI chat transcripts can surface the objections analytics cannot show on their own, such as delivery timing, discount confusion, sizing concerns, or payment trust. That combination, funnel data for the location of the leak and conversation data for the reason behind it, is what turns drop-off rate from a reporting metric into a treatment plan.
Ecommerce Funnel Drop-Off Rate Benchmarks
Stores lose buyers at every step. The useful question is not whether drop-off exists. It is whether your drop-off is normal for your store model, or expensive enough to justify immediate work.
Benchmarks help set that threshold. They are a reference point for triage, not a pass or fail grade. A low-ticket impulse product, a subscription brand, and a high-consideration furniture store will all produce different funnel shapes. Traffic mix matters too. Email and branded search usually carry more intent than paid social or influencer traffic, so they deserve tighter expectations later in the funnel.
Use benchmarks to judge severity, not to copy another store
General product analytics guidance treats relatively low loss between steps as healthy, while much steeper loss can still be normal in lower-intent or longer-consideration journeys. That matters because Shopify merchants often compare the wrong stages. A visitor hitting a PDP from Instagram is still deciding whether the product is relevant. A shopper who has started checkout is deciding whether your store feels trustworthy, affordable, and easy to buy from.
That difference should shape how you read the numbers. Early funnel drop-off usually points to message-market mismatch, weak merchandising, or low-intent traffic. Late funnel drop-off is more expensive. By that point, you already paid to attract the visitor and convinced them to keep moving.
If you want a stronger baseline for what "good" looks like across the store, pair funnel review with a broader Shopify conversion rate optimization program. Funnel benchmarks show where the leak is. CRO work improves the pages and experiences causing it.
Practical ecommerce benchmark ranges by stage
| Funnel Stage Transition | What “healthy” usually looks like | What a concerning drop often signals |
|---|---|---|
| Product page to add to cart | Wide variance by price, traffic quality, and product clarity | Weak value proposition, poor imagery, missing reviews, unanswered product questions |
| Cart to checkout | Should hold up reasonably well for high-intent traffic | Shipping uncertainty, promo-code exits, comparison shopping, trust gaps |
| Checkout start to shipping step | Lower friction than cart stage if checkout setup is clean | Forced account creation, long forms, mobile usability issues |
| Shipping step to payment | Sensitive to total cost and delivery expectations | Shipping cost shock, slow loads, limited delivery clarity |
| Payment to completed purchase | One of the tightest stages in a healthy funnel | Payment failure, limited payment methods, final trust hesitation |
| Three-step funnel cumulative drop | Best judged against your own historical baseline and traffic mix | A stacked problem across product fit, merchandising, checkout friction, and trust |
The pattern matters more than the exact percentage.
A store with average-looking overall drop-off can still be leaking margin if one segment is underperforming badly. I see this often in Shopify audits. Desktop branded traffic converts fine, while mobile paid social collapses between cart and checkout. Blended reporting hides the problem, and broad design changes miss it.
Use benchmarks well by asking:
- Which stage is losing the most revenue, not just the most users?
- Which segments break the pattern: device, source, landing page, country, or new vs returning visitors?
- Which drop increased after a specific change such as a theme update, app install, shipping rule edit, or payment configuration change?
Strong operators build a store-specific baseline, then investigate any stage or segment that moves outside its normal range. That is how benchmarks become a diagnostic tool instead of trivia.
Diagnosing the Common Causes of High Drop-Off
A high drop off rate doesn't tell you what's broken. It tells you where to investigate. The actual work is diagnosis.
The fastest way to get this wrong is to look at one blended number. A checkout drop might look like a checkout problem when it is a mobile problem. Or a country problem. Or a traffic-quality problem.
Sprig's guidance on drop-off analysis makes this point well: teams should segment by device, geography, and behavior so they don't confuse structural friction with situational friction. A mobile-heavy checkout drop may point to form complexity and the need for better autofill, while a country-specific drop may signal payment-method or language mismatch, as described in Sprig's drop-off analysis article.
If you're doing broader store improvement work, this is the same mindset used in Shopify conversion rate optimization. Don't fix the whole store when only one audience segment is struggling.
Cost and trust problems
This category usually shows up late in the funnel. Shoppers liked the product enough to keep moving, then stopped when the economics or credibility felt wrong.
Common triggers include:
- Unexpected shipping costs that only appear after the cart
- Unclear return policy when the shopper wants downside protection
- Weak trust signals around payments, fulfillment, or brand legitimacy
- Coupon anxiety when the cart invites shoppers to leave and search for a code
These leaks often get mislabeled as “abandonment.” In practice, they're objection leaks. The buyer didn't lose interest. The store introduced doubt.
UX and technical friction
Many Shopify stores bleed revenue. The site looks polished, but a few rough edges interrupt momentum.
Watch for problems like:
- Heavy mobile forms that require too much typing
- Forced account creation before purchase
- Laggy drawer carts or checkout redirects
- Apps that clutter the page with overlapping popups, sticky bars, and chat widgets
- Poor field handling for addresses, zip codes, or autofill
The trade-off here is real. Merchants add tools to increase conversion, but stacked apps often create the exact friction they were supposed to solve.
If a shopper has to fight the interface, they won't reward the brand for trying hard.
Information gaps and unanswered objections
Many drop-offs happen because the shopper still has a question and the page doesn't answer it. This is especially common on product pages and carts.
The question might be simple:
- Will this fit?
- Is the material durable?
- How long does shipping take?
- Can I return it easily?
- Which variant is right for me?
When those answers are missing, buyers delay the decision. Delay often looks like abandonment, but it's usually uncertainty. The cleanest fix is to surface the answer before the hesitation becomes an exit.
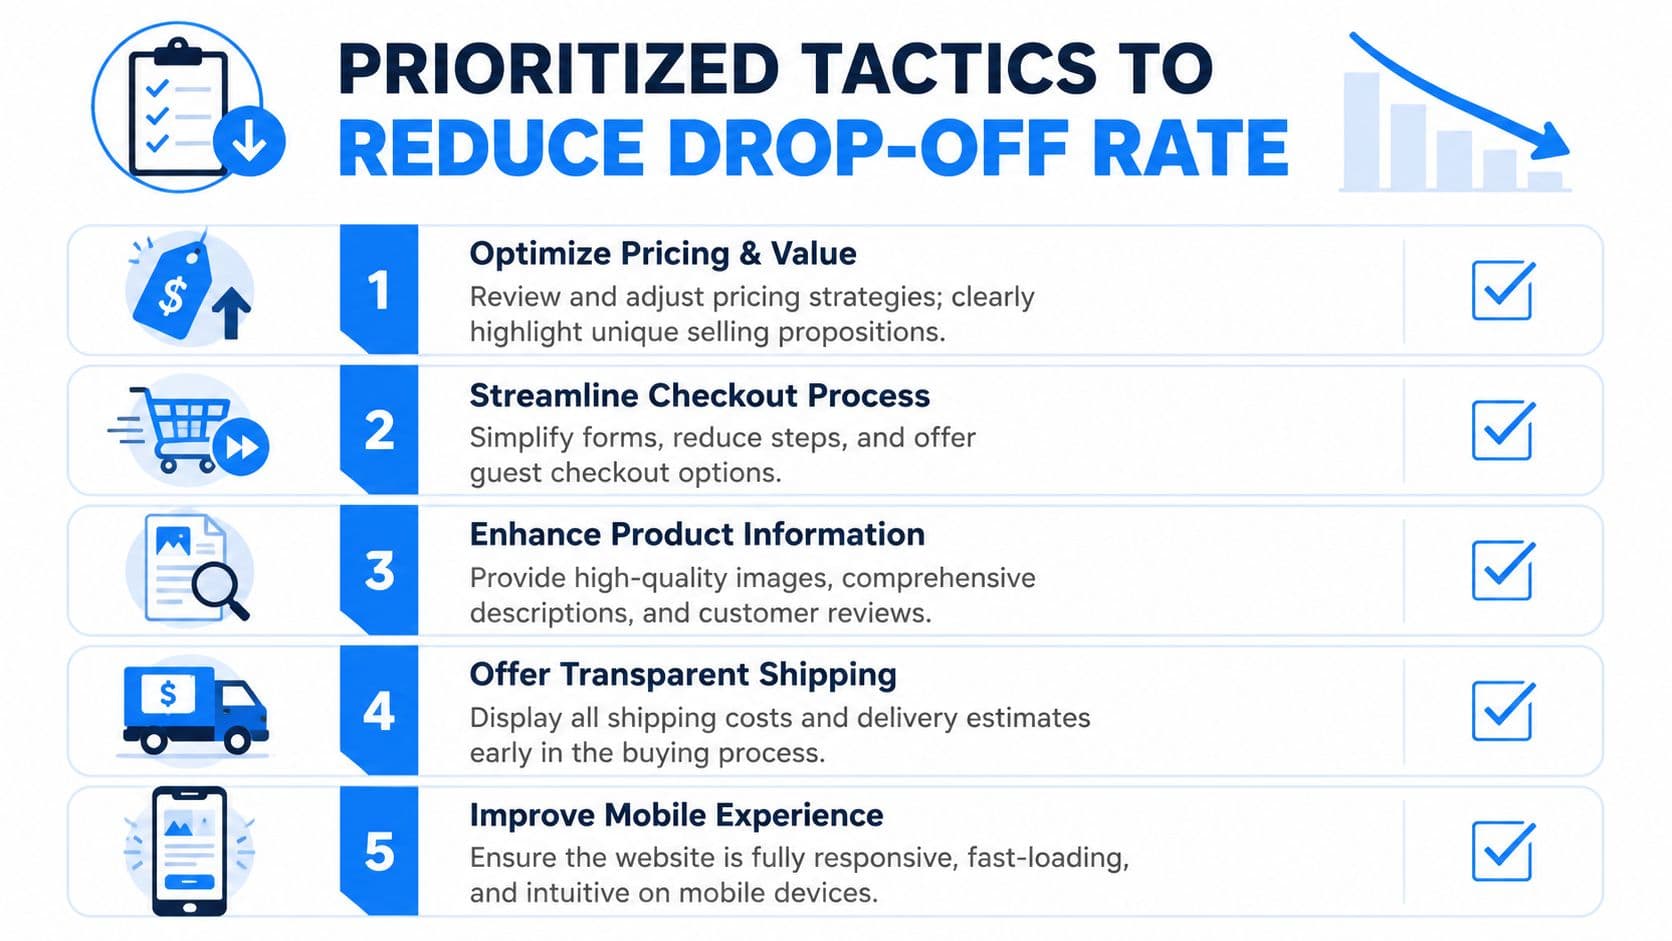
Prioritized Tactics to Reduce Your Drop-Off Rate
The best fixes aren't always the fanciest ones. Start with the changes that remove obvious friction and clarify obvious doubt. A cleaner funnel usually beats a more “optimized” one.
Start with the fixes that remove obvious friction
These are usually the first changes I'd make on a Shopify store because they're visible, direct, and often low effort.
- Show shipping expectations earlier. Don't make shoppers wait until late checkout to discover delivery cost or timing. Put shipping ranges, thresholds, and return basics on product pages, carts, and FAQ surfaces.
- Allow guest checkout. If the store forces account creation before purchase, remove that barrier unless there's a compelling operational reason to keep it.
- Clean up the cart. Remove distractions that invite exits. If the cart is overloaded with upsells, promo fields, and extra navigation, simplify it.
- Tighten trust cues. Put payment confidence, returns, delivery expectations, and contact availability near the point of hesitation, not buried in the footer.
These aren't glamorous changes. They work because they respect buyer momentum.
Then improve movement between steps
Once the obvious friction is handled, look at the transitions.
A product page should move the shopper forward with clear hierarchy. The product title, price, variant selection, delivery guidance, social proof, and add-to-cart action need to work together. If the page makes people work to understand the offer, you'll lose them before cart.
At checkout, mobile experience becomes decisive. Reduce typing. Enable autofill wherever the setup allows. Check that buttons sit above the fold on common mobile viewports. Test your own flow using a real phone, not only a desktop preview.
For cart-stage improvement, merchants usually get the best returns from a short list:
- Reduce visual clutter so the primary action is obvious.
- Keep editing easy so quantity and variant adjustments don't require backtracking.
- Reinforce purchase confidence with concise delivery and return messaging.
If cart abandonment is a recurring pain point, this is the same operational work behind reducing cart abandonment on Shopify. The stores that recover more revenue usually remove hesitation before they send recovery emails.
Finally close the information gap in real time
A surprising number of drop-offs come from small unanswered questions. Merchants often try to solve this only with longer product descriptions. That helps, but it's not always enough.
Use a layered approach:
- Improve product-page content with sizing, compatibility, materials, and use-case details
- Add FAQ content near the buying action instead of hiding it on a separate page
- Use customer reviews strategically to answer practical objections, not just to decorate the page
- Offer real-time assistance when shoppers hesitate on high-intent pages
This is also where modern AI chat can help. Not as a generic support bubble, but as a live sales assistant that answers questions before the shopper leaves. The strongest implementations don't wait for a support ticket. They surface the right answer when the buyer is uncertain about fit, shipping, returns, or product choice.
Field note: If a human sales associate would step in at that moment in a physical store, the site should do something comparable online.
How Carti Turns Drop-Offs into Conversions
Generic chat widgets don't reduce drop-offs by themselves. Many of them just add another icon to the screen. The useful version of AI chat is proactive, specific, and tied to the moments where shoppers hesitate.
Where AI chat helps most
Carti is built for that job inside Shopify. Its Instant Answers help close information gaps that otherwise stall a purchase. If a shopper wants to know about shipping, returns, sizing, or product details, they can get an answer immediately instead of leaving to search your site or emailing support.
Its Smart Suggestions also help when the problem isn't confusion but indecision. Shoppers often drop because they can't choose, aren't sure which product fits their need, or need a nudge toward the right variant. In those moments, guided recommendations can move the session forward instead of letting it fade out.
Then there's Cart Recovery. Some shoppers will still drift at the edge of purchase. Timely prompts and reminders can bring them back before that intent disappears.
Why this changes the diagnostic loop
The more interesting piece is the feedback loop. Carti's Insights Dashboard surfaces the questions shoppers ask most often. That gives merchants a practical diagnostic view of why people hesitate.
If shoppers repeatedly ask about delivery timing, your shipping messaging likely isn't prominent enough. If they keep asking about fit or compatibility, the product page needs stronger content. If the same objections appear before checkout, you've found a drop-off cause you can fix.
That's why AI chat can do more than rescue individual sessions. Used well, it becomes an ongoing source of funnel intelligence.
Frequently Asked Questions About Drop-Off Rate
Is drop off rate the same as bounce rate
No. Bounce rate is about sessions with little or no meaningful engagement on a page or visit. Drop off rate is about people entering a defined multi-step flow and failing to continue to the next step. Bounce rate is broader. Drop off rate is more useful for funnel diagnosis.
Is cart abandonment rate the same thing
Not exactly. Cart abandonment is a specific form of funnel drop-off. It focuses on people who add to cart and don't complete purchase. Drop off rate can be measured at any defined step, including product page to cart, checkout start to shipping, or payment to purchase.
How often should a Shopify store check drop off rate
Check it often enough to catch changes before they become expensive. For most active stores, that means reviewing funnel steps regularly and checking more closely after theme edits, app installs, promotions, shipping changes, or campaign launches.
What's a good drop off rate
There isn't one universal ecommerce answer. Context matters. Funnel stage, device mix, product type, traffic source, and price sensitivity all change what “good” looks like. Use benchmarks carefully, but rely more on segmented patterns and your own baseline.
What should I fix first if my drop off rate is high
Fix the step with the biggest leak that also has clear buyer intent. In many Shopify stores, that means checkout friction, surprise costs, weak mobile UX, or unanswered product questions. Start where intent is strongest and friction is easiest to remove.
If you want to turn more hesitant Shopify visitors into buyers, Carti gives shoppers instant answers, smart product guidance, and timely cart recovery without adding operational overhead. It's a practical way to reduce funnel leakage while learning exactly what your customers need to complete the purchase.

Written by
Daniel AndersonFounder of Carti. 10+ years building ecommerce brands in apparel and supplements. Still runs a Shopify store and built Carti to help merchants convert more browsers into buyers.
Ready to boost your store's sales?
Install Carti in 5 minutes and let AI handle customer questions, recommend products, and close sales 24/7.
Start Free Trial14-day free trial